**other members this info is posted for fellow member aihua5 to describe pa reading, feel free to have a look and make comments. analysis used is fib retrace lines pattern and basic Mclaren principals.
Hi aihua,
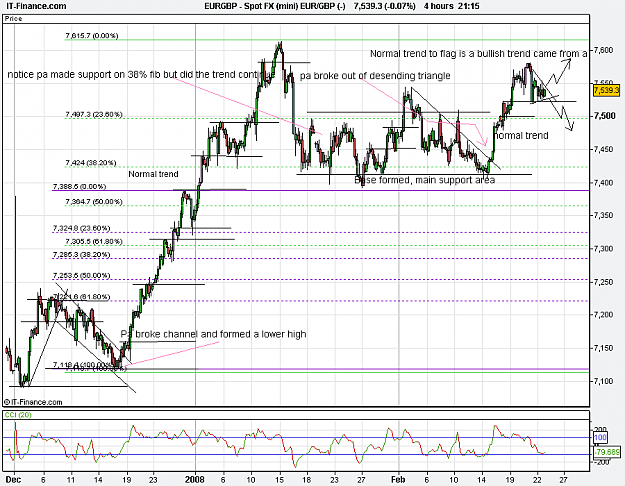
we will move from left to right of the attached chart.
ok first area
Pa made a minor rally off a base the pa run into trouble topped. dipped down made a lower high to double top. that formed a bear channel. Pa also formed a descending triangle and a lower high. once the pa broke out of the descending triangle then made a lower high just out of it that was the clue that a trend is on. as the trend moved up the resistance had a space to the next support that is a normal trend. price moved up in a normal fashion till the 6th 2008 when it made it's first creep base, the pa made a tripple bottom to confirm support. as you can see it made a lower high again then it broke out of the range. pa retested the resistance , that became support and it continued north.pa kept going till it fell over on the 15th in two strong bars down, now that was the first clue in pa changing behavior! that was the first 2 bar move down for that many pips in the counter trend!
Down move into trading range (Base)
ok now pa moved up but it failed and moved down again that's a lower high trend could be changing! pa broke support and made a new low confrimation of the new trend down. pa moved down in a normal trend till it made a base at the 38% point of the fib now did the pa continue up? no it moved into a range the pa put in a final low to lower high then it moved up to test the range made a thust out of the range lost motion and formed a base that broke back down into the range. see the lower high and the fact that it failed at finding support on the range top.. once the counter trend failed and made a new low that says no longs. stay out! watch for ne evidence and patterns. pa made two more hits at the top failed now it trended down to the base what is that a descending triangle! we may have something here. pa hit support and moved off it that made 3 hits on that support base. pa broke out of triangle. and made a normal trend up. on the second weakness that was a big bar down forming a creeping motion. pa moved up then down to down to the final green candle look at the shape that is a flag. flags are normally bullish continuation patterns but are we at a new high in this chart no we are not. we are under the last high still in a wider range. yes you can have ranges trends and patterns inside ranges.
I would wait for a break of the pattern followed by a lower high or higher low to make my play. if it breaks up look for it to make a lower high on or above the last high to tell you a new high and trend is possibility in the making.
aihua, this is the basics in trend reading and pattern trading, like the 4 hour u don't trade every thing u look for good lead ups and patterns to make your play. what is lead up? ok if the pa breaks up and then makes a new high, falls bounces off that high move up again. that is great cuz the base it just formed is the lead up it consolidated charged up and broke up. a bullish continuation pattern in it's self!
no u see my point about fibs as a guide only, yes it found support there but did it break off it and keep going up no it did not. but that level acted as a good base till the descending triangle came with the 3 touches and the break of that pattern. that's why we need to look at it all. we need lots of evidence to fire not just 1 small fact!
hope that helps.
Cheers
Joseph
Hi aihua,
we will move from left to right of the attached chart.
ok first area
Pa made a minor rally off a base the pa run into trouble topped. dipped down made a lower high to double top. that formed a bear channel. Pa also formed a descending triangle and a lower high. once the pa broke out of the descending triangle then made a lower high just out of it that was the clue that a trend is on. as the trend moved up the resistance had a space to the next support that is a normal trend. price moved up in a normal fashion till the 6th 2008 when it made it's first creep base, the pa made a tripple bottom to confirm support. as you can see it made a lower high again then it broke out of the range. pa retested the resistance , that became support and it continued north.pa kept going till it fell over on the 15th in two strong bars down, now that was the first clue in pa changing behavior! that was the first 2 bar move down for that many pips in the counter trend!
Down move into trading range (Base)
ok now pa moved up but it failed and moved down again that's a lower high trend could be changing! pa broke support and made a new low confrimation of the new trend down. pa moved down in a normal trend till it made a base at the 38% point of the fib now did the pa continue up? no it moved into a range the pa put in a final low to lower high then it moved up to test the range made a thust out of the range lost motion and formed a base that broke back down into the range. see the lower high and the fact that it failed at finding support on the range top.. once the counter trend failed and made a new low that says no longs. stay out! watch for ne evidence and patterns. pa made two more hits at the top failed now it trended down to the base what is that a descending triangle! we may have something here. pa hit support and moved off it that made 3 hits on that support base. pa broke out of triangle. and made a normal trend up. on the second weakness that was a big bar down forming a creeping motion. pa moved up then down to down to the final green candle look at the shape that is a flag. flags are normally bullish continuation patterns but are we at a new high in this chart no we are not. we are under the last high still in a wider range. yes you can have ranges trends and patterns inside ranges.
I would wait for a break of the pattern followed by a lower high or higher low to make my play. if it breaks up look for it to make a lower high on or above the last high to tell you a new high and trend is possibility in the making.
aihua, this is the basics in trend reading and pattern trading, like the 4 hour u don't trade every thing u look for good lead ups and patterns to make your play. what is lead up? ok if the pa breaks up and then makes a new high, falls bounces off that high move up again. that is great cuz the base it just formed is the lead up it consolidated charged up and broke up. a bullish continuation pattern in it's self!
no u see my point about fibs as a guide only, yes it found support there but did it break off it and keep going up no it did not. but that level acted as a good base till the descending triangle came with the 3 touches and the break of that pattern. that's why we need to look at it all. we need lots of evidence to fire not just 1 small fact!
hope that helps.
Cheers
Joseph
Attached Image (click to enlarge)