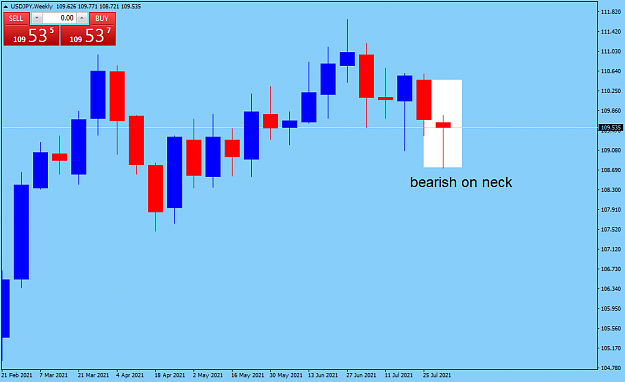
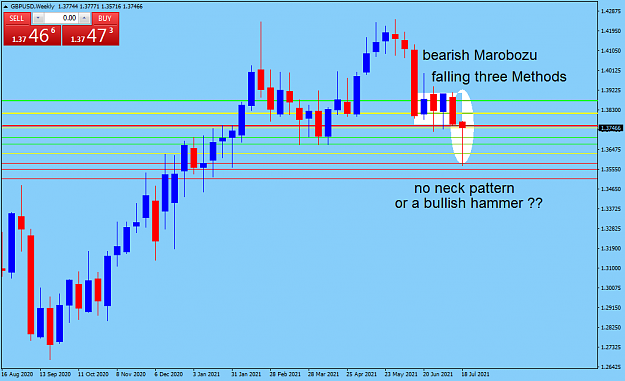
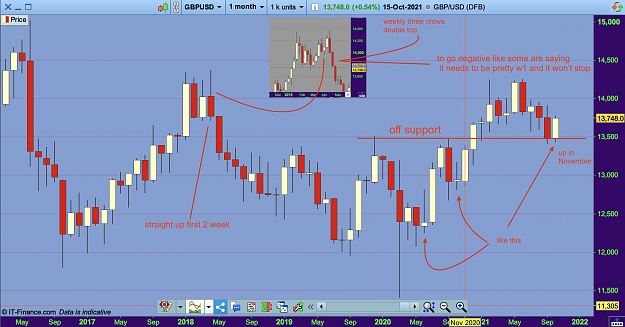
weekly candle chart GBPUSD after a reversal patter (bearish Marobozu) and then for confirmation this downtrend we can see a bearish continuation pattern (falling three methods) . for this week we have a test of lower wick 1.3570 . now we can see a forming of reversal pattern (hammer ) or a bearish continuation pattern (on neck ).maybe two bearish continuation pattern will show to us a big fall in the next days or we will see a good work by this reversal pattern {image}
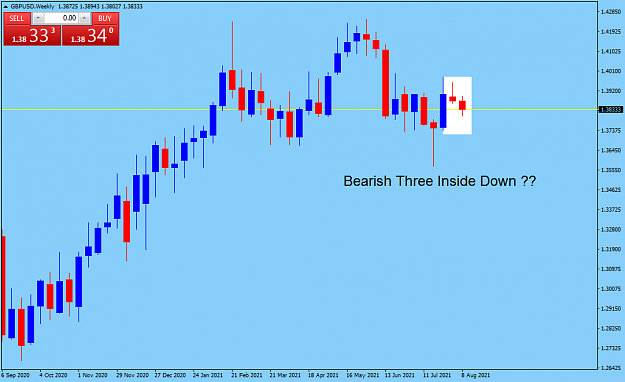
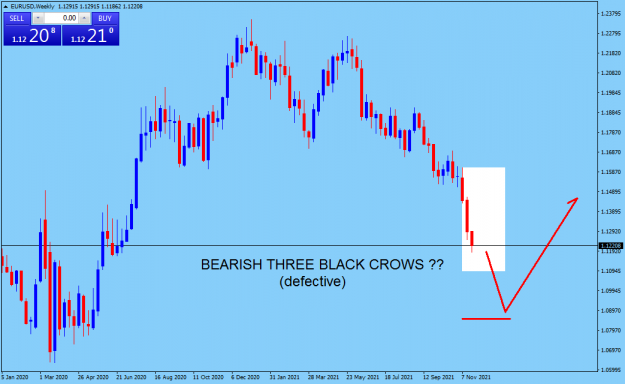
weekly candle chart GBPUSD we can see a bearish three inside down (of curse defective) in this time . we know that a Bearish Three Inside Down already signals a trend reversal .
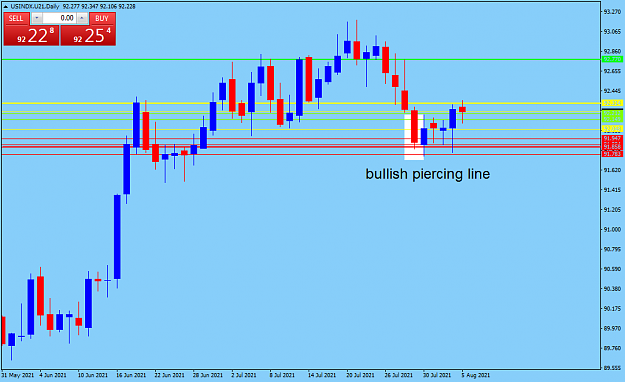
weekly candle chart GBPUSD we can see a bearish three inside down (of curse defective) in this time . we know that a Bearish Three Inside Down already signals a trend reversal . {image}
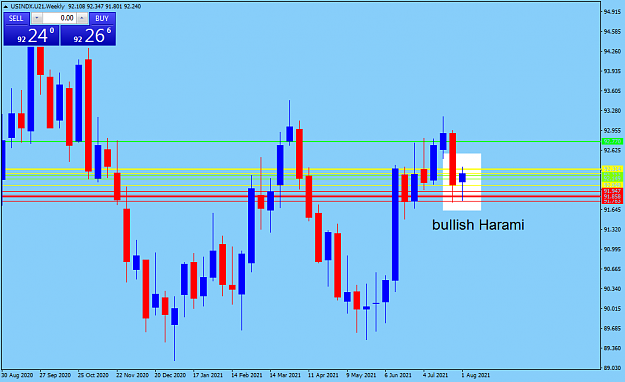
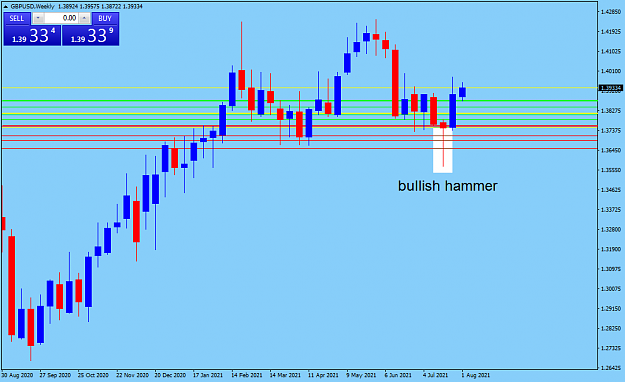
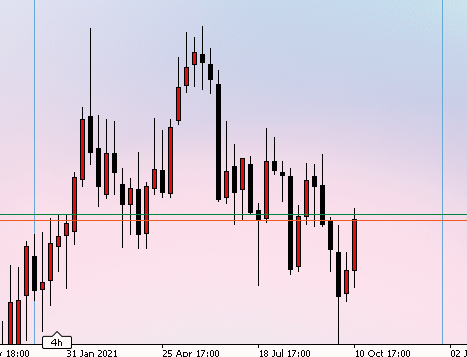
Hi everyone hope you are fine,hyssin,Bones,.... Want to refresh my memory in candlesticks after a while COVID, life , so on GBPUSD I see in the weekly chart a secondary signal Three inside Up ? Seems buying starting again,What do you think guys? 4061186 {image}
Ignored
hey Z ,yea with wick first ,
the weekly has been failing though
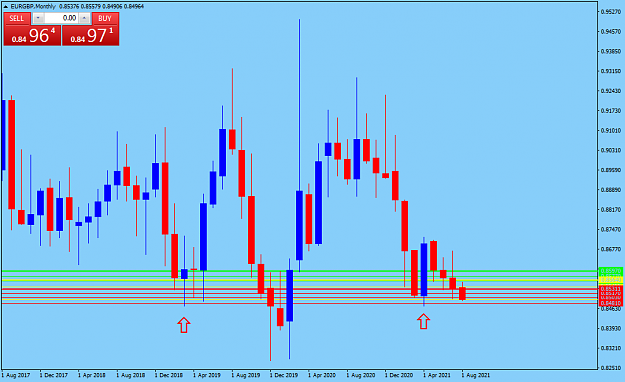
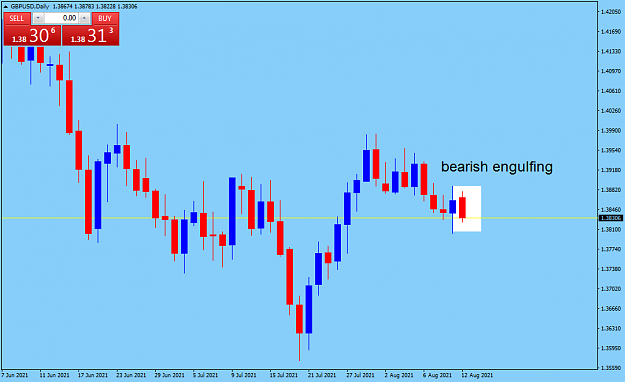
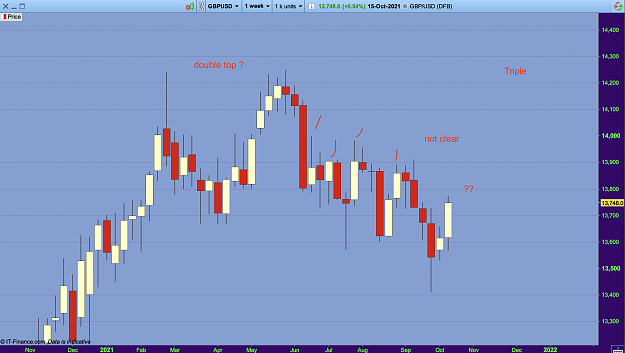
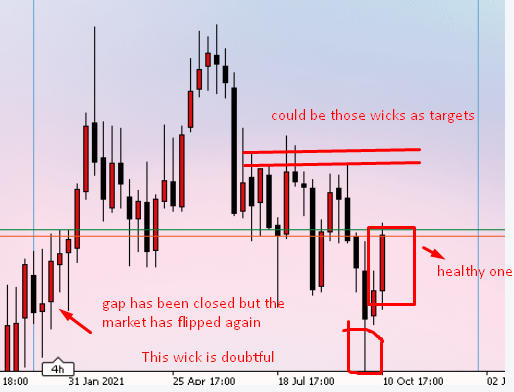
{quote} Yea I think it will break that consolidation up ,I'm cautious because that last weekly bullish set up I thought it could go further then . {image}
Ignored
Ok i see what you mean
It is not yet the monthly bargain to buy and hold.
in the weekly the signal is here but the monthly need a bottom for possible Morning star and this will be a major reversal
good stuff B,
If skills could be acquired by watching, every dog would be a butcher. Turk