GBPUSD Weekly Technical Outlook
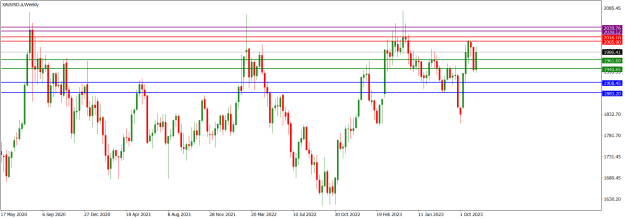
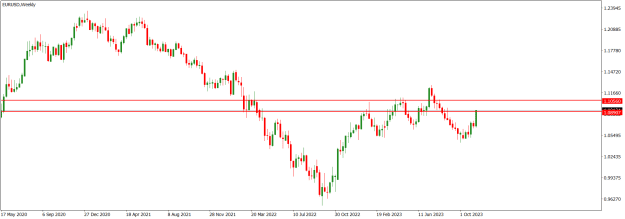
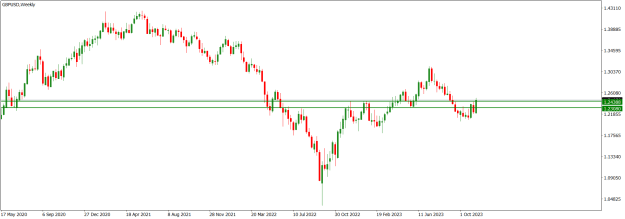
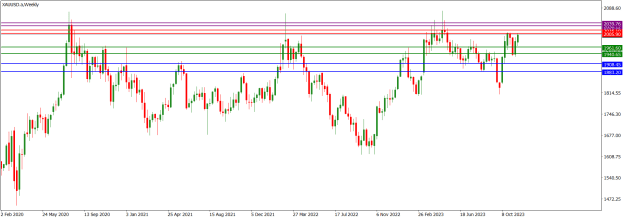
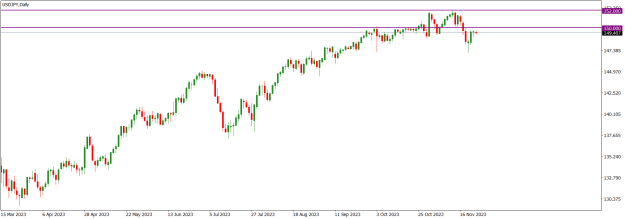
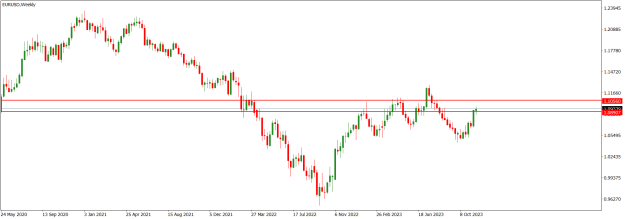
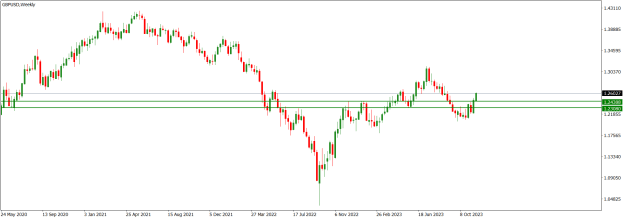
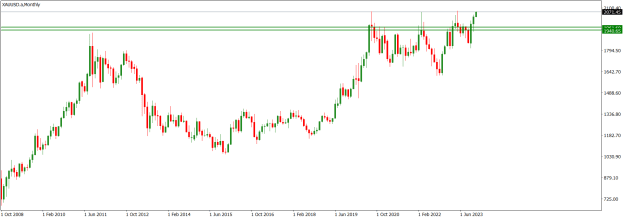
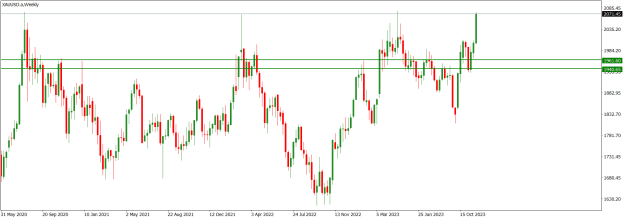
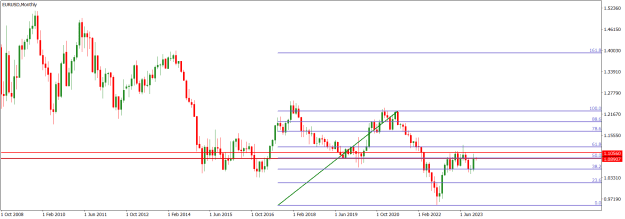
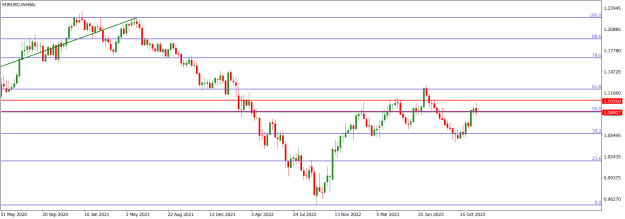
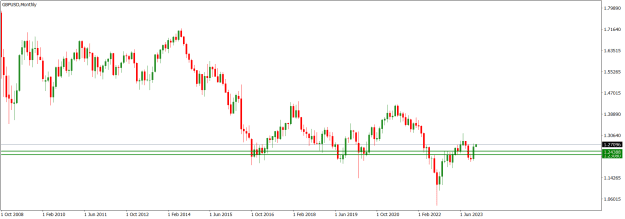
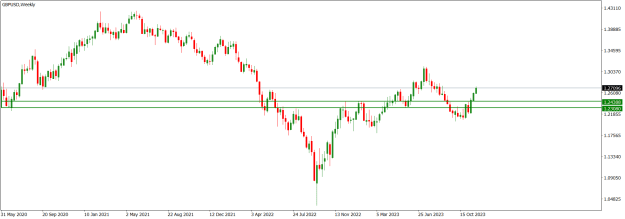
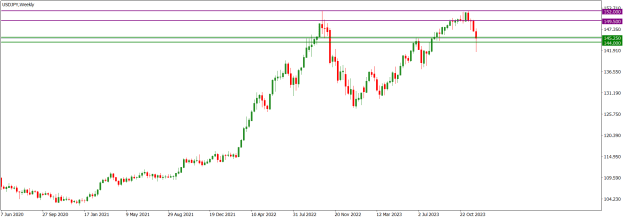
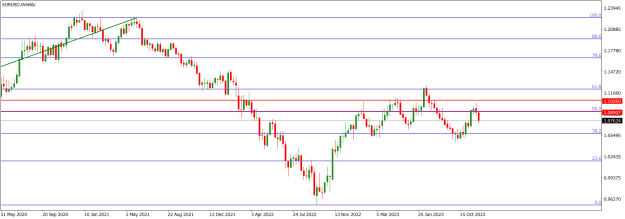
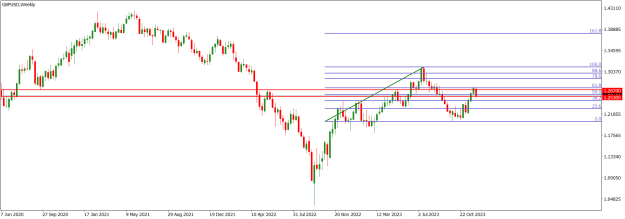
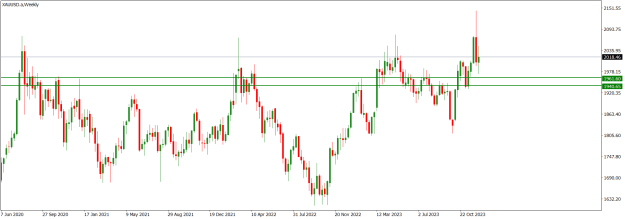
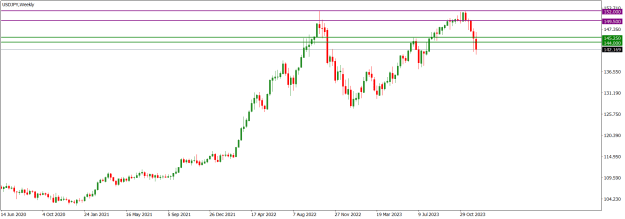
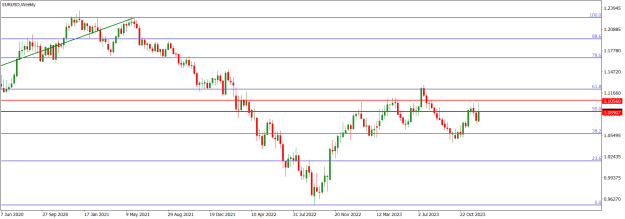
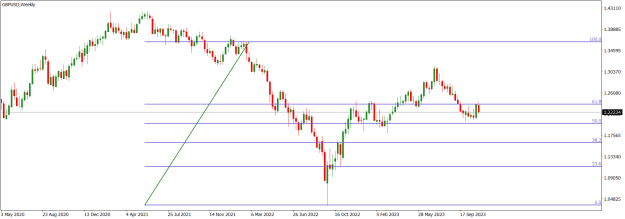
Two weeks ago, GBPUSD market operation on the weekly time frame retested the 61.8 Fib area of the dominant bearish swing. But last week, bears resisted further northward move, and market operation printed a relatively moderate bearish candlestick.
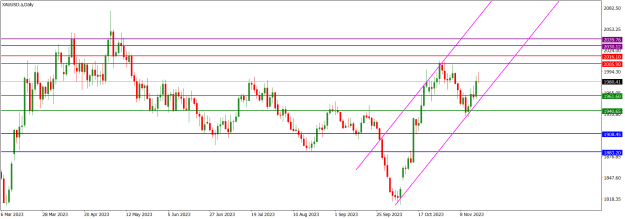
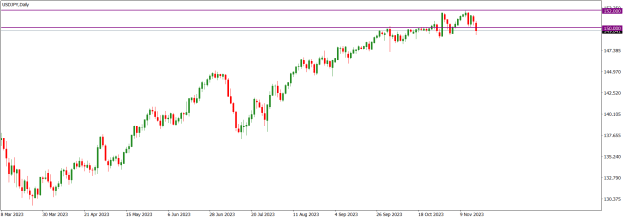
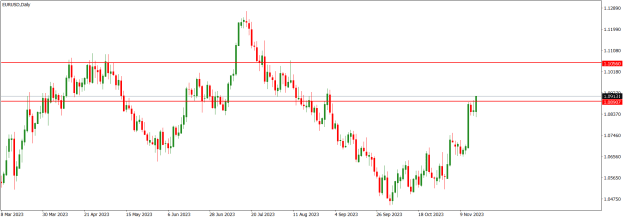
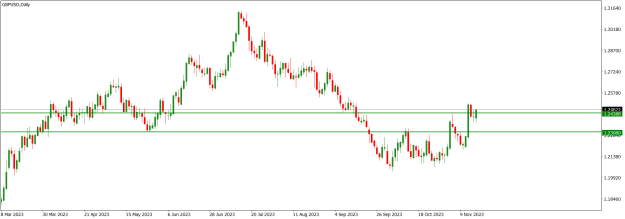
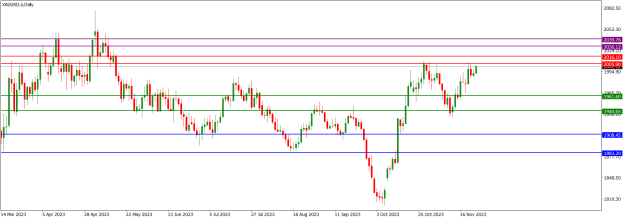
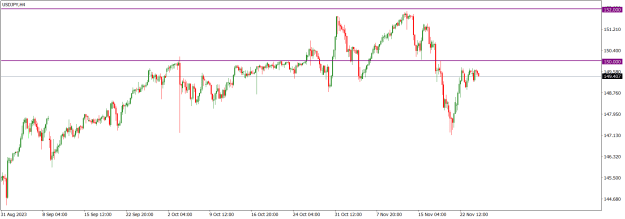
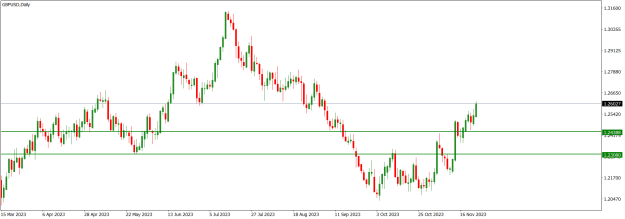
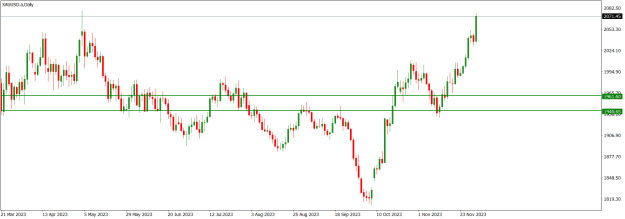
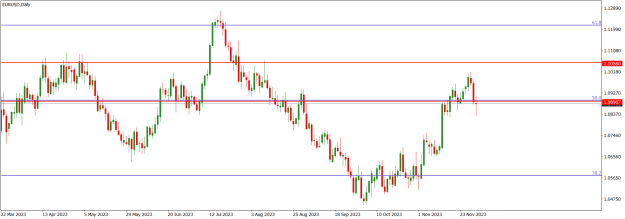
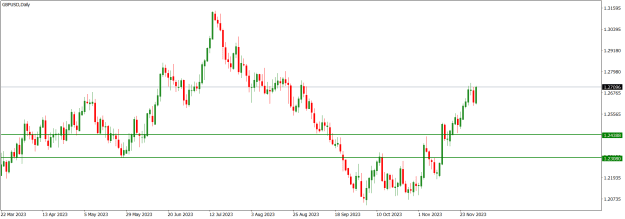
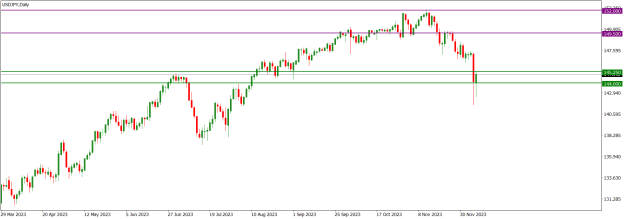
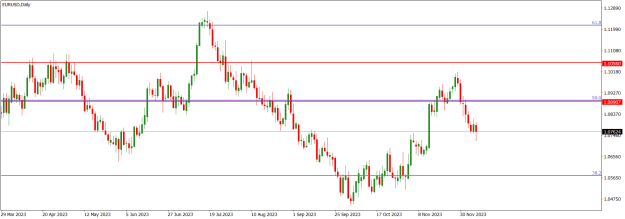
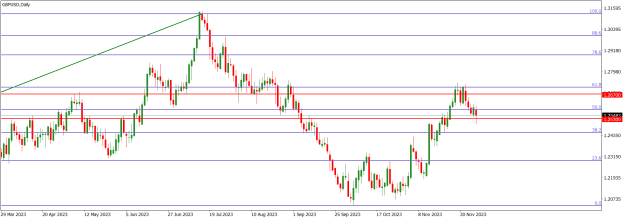
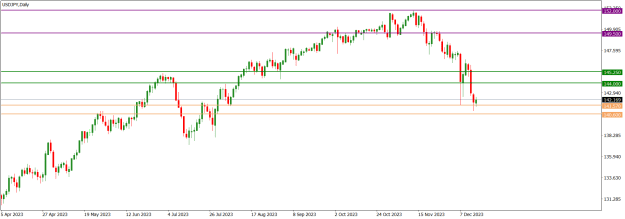
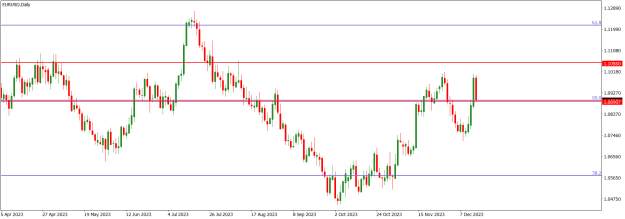
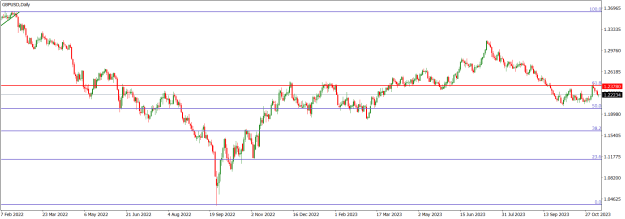
Last week Monday, GBPUSD price action on the daily time frame made a bearish rejection of the 1.23780 horizontal resistance area (red). There was a bearish continuation until Friday when price action went sideways. Nevertheless, as the technical structure is bearish, any northward move would be temporary.
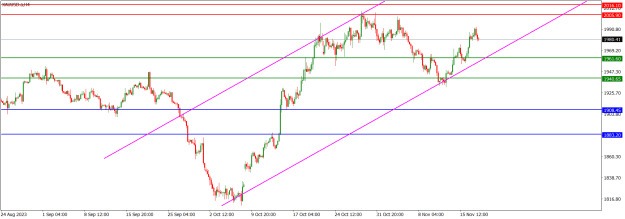
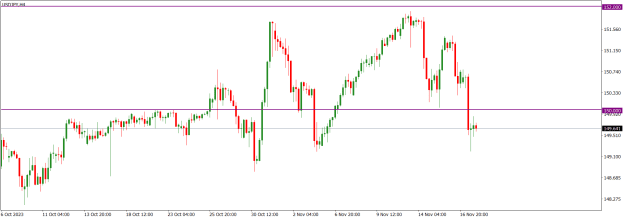
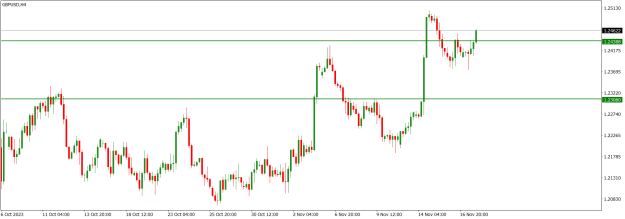
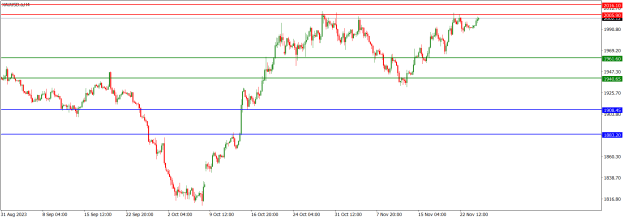
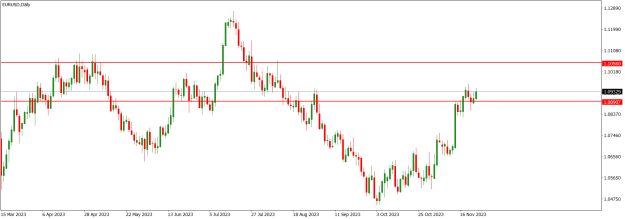
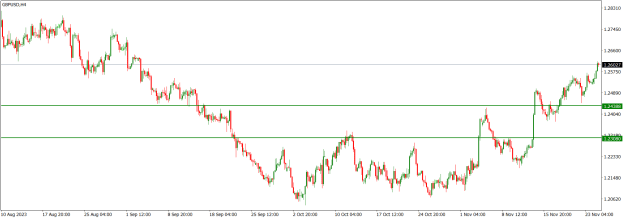
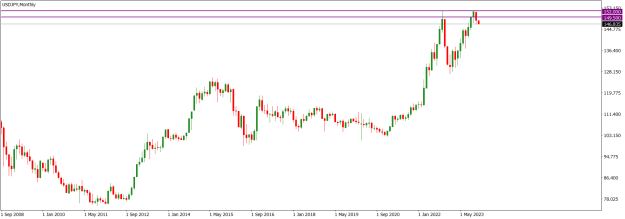
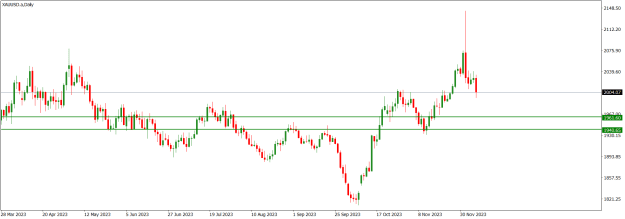
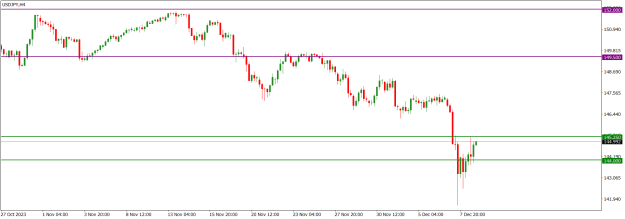
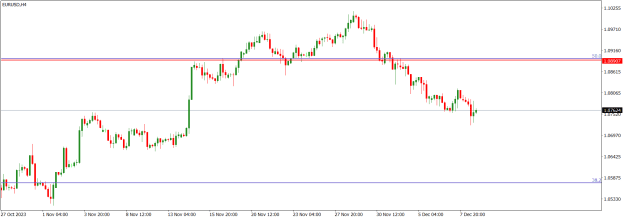
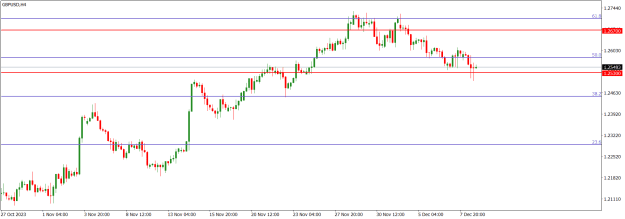
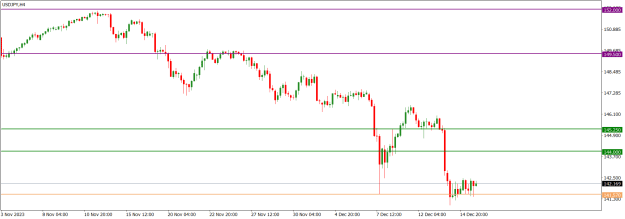
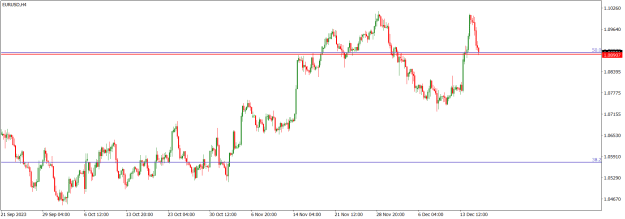
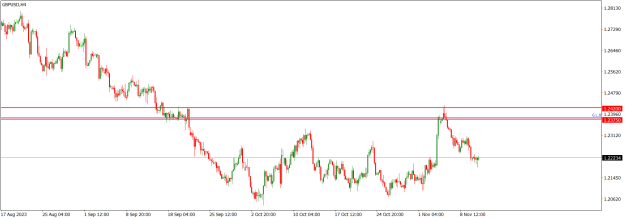
On Monday November 6, 2023, GBPUSD price action on the H4 time frame retested the 1.24200/1.23750 supply (red) but made a bearish turnaround in the area. Presently, price action is sideways, but the dominant technical structure is bearish.
I may be wrong. Trade safe and prosper.
KP
Two weeks ago, GBPUSD market operation on the weekly time frame retested the 61.8 Fib area of the dominant bearish swing. But last week, bears resisted further northward move, and market operation printed a relatively moderate bearish candlestick.
Attached Image (click to enlarge)
Last week Monday, GBPUSD price action on the daily time frame made a bearish rejection of the 1.23780 horizontal resistance area (red). There was a bearish continuation until Friday when price action went sideways. Nevertheless, as the technical structure is bearish, any northward move would be temporary.
Attached Image (click to enlarge)
On Monday November 6, 2023, GBPUSD price action on the H4 time frame retested the 1.24200/1.23750 supply (red) but made a bearish turnaround in the area. Presently, price action is sideways, but the dominant technical structure is bearish.
Attached Image (click to enlarge)
I may be wrong. Trade safe and prosper.
KP
Do your homework, follow the footprints of smart money
1