So far, today, I had 4 trades and all stopped out. I didn't take EURCAD trade but it was stopped out, too. Only AUDNZD trade (I didn't take this one either) is open now and moving around entry price. Most of these trades were turning point trades.
Many Thanks to you Albert.
Through your thread i discovered the Similarity and Dis-Similarity introduced years ago by EurUsdd.
I spent my week end reading through it, i am around the hundreds pages and i still have a lot to learn, but even at that level i have learnt a lot and my trading is improving fast.
You are doing a great work by re-introducing that way of trading.
Many Thanks .....
So far, today, I had 4 trades and all stopped out. I didn't take EURCAD trade but it was stopped out, too. Only AUDNZD trade (I didn't take this one either) is open now and moving around entry price. Most of these trades were turning point trades. Regards, Blackeagle
Ignored
I understand you. But I don't think we need to take Al's word hook line and sinker. We need to test this setup on demos first until we are reasonably sure of what we are doing. One thing I have discovered in Forex is that you have to tweak any giving trading strategy to suit yourself if you decided to go for it.
I have checked Al's tweak, Landline's and anyone that caught my interest.
Since I saw this thread, I made great improvements in my trades. Demo though. I will only goes live with this after series of testings. I will drop my present demo and open another one. After that i will go live with this strategy if it suits me.
Just this morning taking little trades.
Note that i really started trading on this demo on the 9th of September. A day after Al started this tread. I cant really say i have figured anything out yet. Just trying.
Wolero7, Good Luck with your demoing. I see that there are various time frames that you are using, but what is the time frame for the results and what time frame do you prefer? Thanks
Ignored
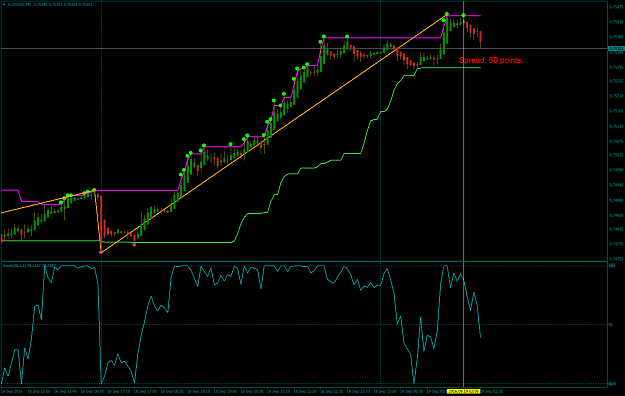
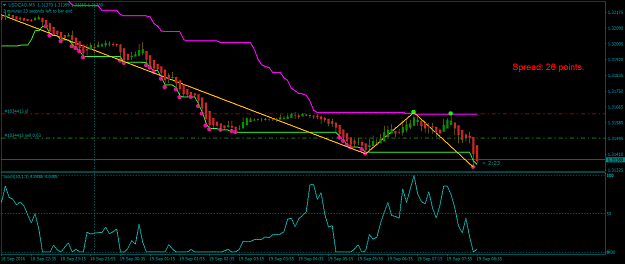
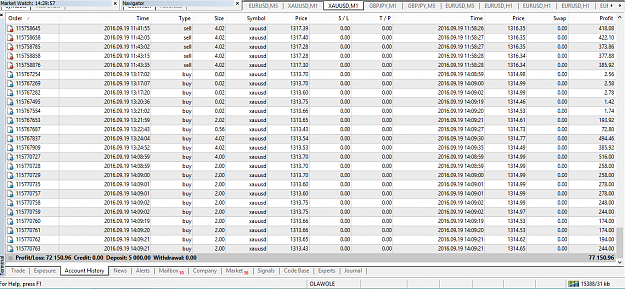
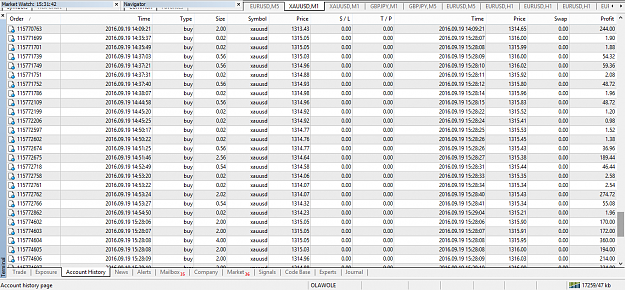
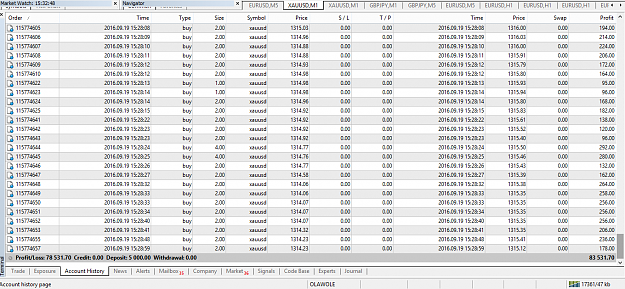
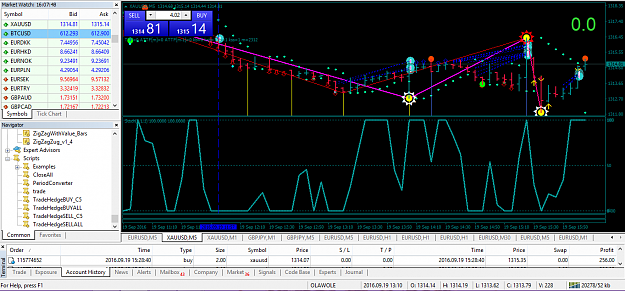
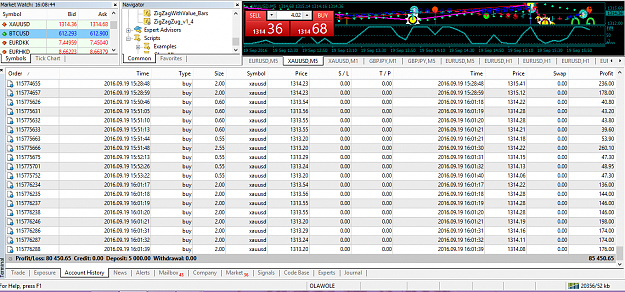
I trade using semafor and post zig zag posted here on 30min , 5 mins and 1 mins. This is how my chart looks like and other trades i took. I will not want to discuss anything aside this for now. So as not to derail the thread. The reason am just posting this is to appreciate Al's effort and encourage anyone to test strategy out thoroughly before going live. I use close all script to close all trades.
{quote} I trade using semafor and post zig zag posted here on 30min , 5 mins and 1 mins. This is how my chart looks like and other trades i took. I will not want to discuss anything aside this for now. So as not to derail the thread. The reason am just posting this is to appreciate Al's effort and encourage anyone to test strategy out thoroughly before going live. I use close all script to close all trades. Cheers. {image} {image}
Ignored
Thanks for sharing. Make sure you keep up this good work!!!! .
My help is in the name of the Lord who made heaven and earth.
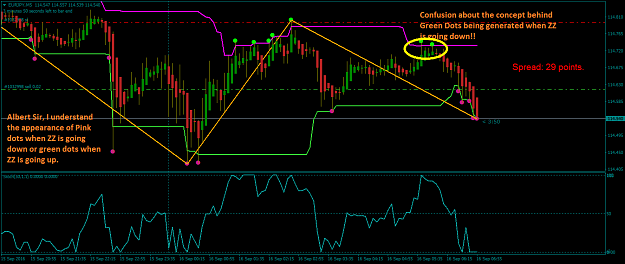
In one of your posts you mentioned that the latest version is a new angle and has nothing to do with the stochastic. About the dots that are being generated:
" Like the ZZ it marks the H/L of the period( 30 in this case). So it is directly related to the ZZ. A dot appears if that candle stick goes higher or lower than the previous 30 candles just like the ZZ."
Kindly advise me on where i have missed the point:
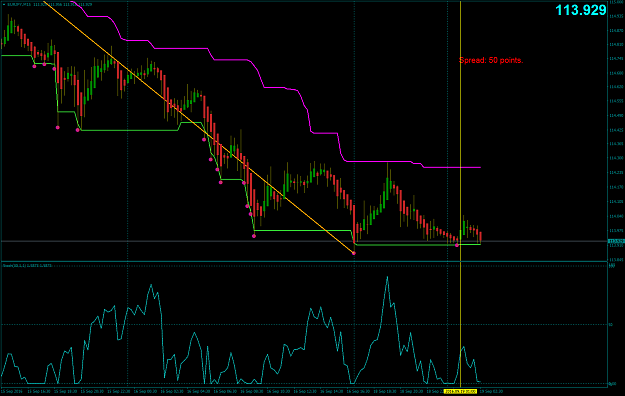
Attached Image (click to enlarge)
1. In a ZZ down move, pink dots are the places where ZZ has been. So it means a pink dot represents the lowest low of the past 30 periods at that given moment. If on subsequent candles the candles keep going lower than the previous 30 candles new pink dots would be generated. This principle is same for green dots when the ZZ is on a up move except the green dot being the highest high of the last 30 periods.
2.My confusion is on a down move, what is the concept behind/ How are the Green Dots (Dis-Similarity) being generated?
I mean, a green dot represents the highest high over the last 30 periods. So during a down move of ZZ, shouldn't the appearance of green dot indicate the start of a New ZZ leg in the upward direction. Since by definition, a new up ward zig zag is drawn when the high of last 30 periods is broken?
3. Is stochastic relevant to this system or can we just ignore it?
4. This Donchian channel is different from the standard right, how did you come up with the tweaking?
5. For S/L are we trail the last 30 periods high/low or is the ZZ High or Low?
Thanks for your patience. Sir, I know too many questions, kindly take your own time to answer me.
Albert Sir, In one of your posts you mentioned that the latest version is a new angle and has nothing to do with the stochastic. About the dots that are being generated: " Like the ZZ it marks the H/L of the period( 30 in this case). So it is directly related to the ZZ. A dot appears if that candle stick goes higher or lower than the previous 30 candles just like the ZZ." Kindly advise me on where i have missed the point: {image} 1. In a ZZ down move, pink dots are the places where ZZ has been. So it means a pink dot represents the lowest low of...
Ignored
Hi Aaven, I understand your confusion. Its my fault to have introduced this. Its a lot to explain how the indi works especially that I do not have all the facts......It relates to the ZZ and the Stoch in that they all can be visibly mapped to one another.
It could be traded with the ZZ alone, but not with the Stoch. I could give another example of how the ZZ and the bollinger bands could be traded but that will further confuse us all.
I think our aim is to make pips......I have to appologise for introducing other things.
Lets get simple. I entreat us all to stick with the ZZ-Stoch setups and possibly maintain the same values for both, it works.
Al.
My help is in the name of the Lord who made heaven and earth.
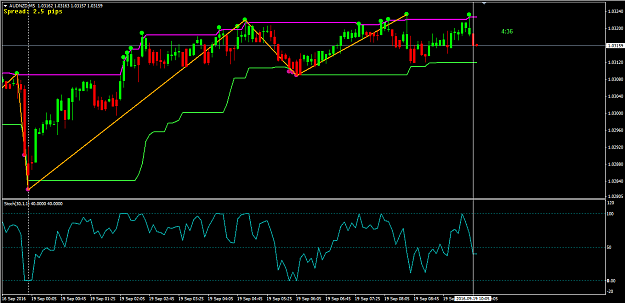
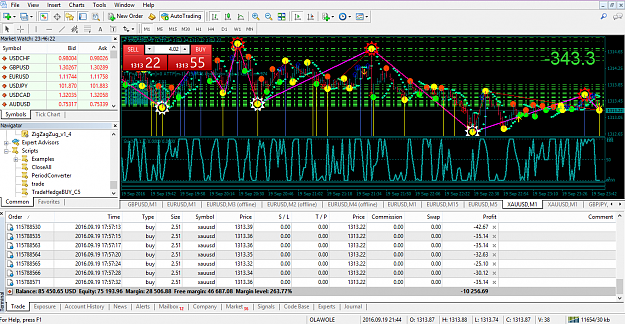
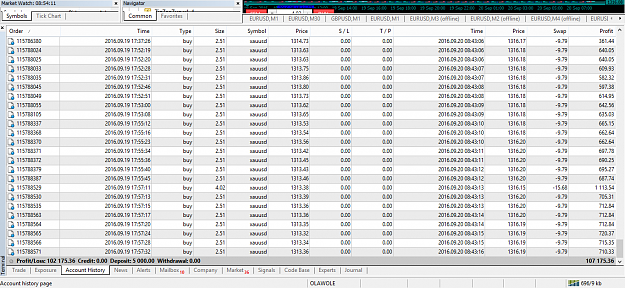
My last trades yesterday were the hardest for the day. Just closed them now. At a point I was down by the first picture attached until it eventually went north. Still working on a better entry system. To be successful, one need a good MM system too.
{quote} Hi Aaven, I understand your confusion. Its my fault to have introduced this. Its a lot to explain how the indi works especially that I do not have all the facts......It relates to the ZZ and the Stoch in that they all can be visibly mapped to one another. It could be traded with the ZZ alone, but not with the Stoch. I could give another example of how the ZZ and the bollinger bands could be traded but that will further confuse us all. I think our aim is to make pips......I have to appologise for...
Ignored
Hi Albert,
One of my favorite indicator is Bollinger Band, could you explain how to use ZZ along with BB?
Thanks in advance.
A person who never made a mistake, never tried anything new.