https://capitalstreetfx.com/en/wp-co...ner_report.jpg
Asian shares edged up on Tuesday, taking their cue from European and U.S equities last night which shot up on the dovish comments from Federal Reserve Governor Lael Brainard. In a speech to the Chicago Council on Global Affairs, Brainard – one of six permanent voters on the Fed committee – stated that a labor market which is not-yet-at-full-employment and economic weakness abroad may demand more prudence in the move toward tighter Fed policy.
Brainard’s comments weakened the case for a September rate hike, triggering the recovery in stocks and weakening the U.S dollar.
Large Japanese manufacturers turned optimistic over the country’s business conditions in the third quarter, the joint survey by the Ministry of Finance and the Economic and Social Research Institute showed on Tuesday. The business survey index (BSI) which measures business sentiment among big manufacturers’ during the July-September period, came out at 2.9, beating expectations for a reading of -6.5.
The Australian dollar dipped slightly in early trade following comments from Reserve Bank of Australia assistant governor Christopher Kent on the need for a weaker currency. The central bank official said that the Aussie had not depreciated as much as expected in response to weaker commodity prices and cuts in interest rates that have brought the cash rate to a record low of 1.5%.
Australia’s biggest trading partner, China, is reporting some signs of recovery after some disappointments in July. Data from the National Bureau of Statistics indicated that factory output, investment and retail sales all exceeded forecasts. Industrial production rose by 6.3 percent from a year earlier in August, retail sales climbed 10.6 percent last month, compared to the same period last year while fixed-asset investment increased 8.1 percent year to date.
Technicals
EURJPY
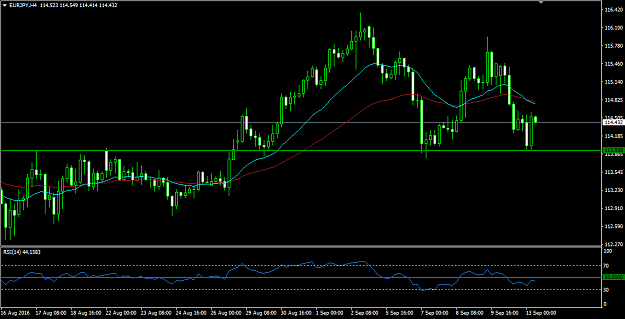
Fig: EURJPY H4 Technical Chart
EURJPY generally has been on a decline from as high as 115.938. The short-term MA has just crossed over the long-term MA from above, consolidating the downtrend. Sellers are still overwhelming the market, suggesting more down moves which may push the pair to as low as 113.930.
Trade suggestion
Sell Stop at 114.400, Take profit at 113.930, Stop loss at 114.430
NZDUSD
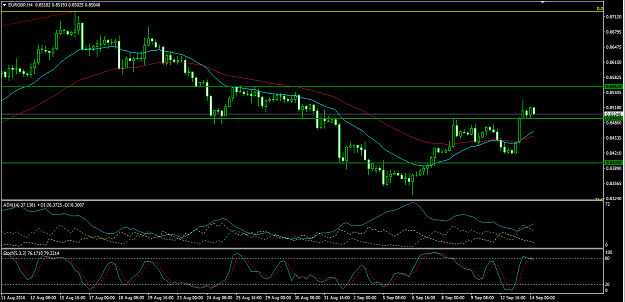
Fig: NZDUSD H4 Technical Chart
After failed attempts to break above the 50% retracement at 0.74715, NZDUSD not only fell back into the ascending trading channel but also hit a more-than-one-week low at around 0.72898. The pair pulled back from the lower boundary of the channel and is currently facing firm resistance at 0.73420. Weakening bulls have failed to push the price past the MA20. The market remains in bearish territory. With the RSI pointing towards the oversold zone, further declines are expected.
Trade suggestion
Sell Stop at 0.73370, Take profit at 0.73110, Stop loss at 0.73650
GBPCAD
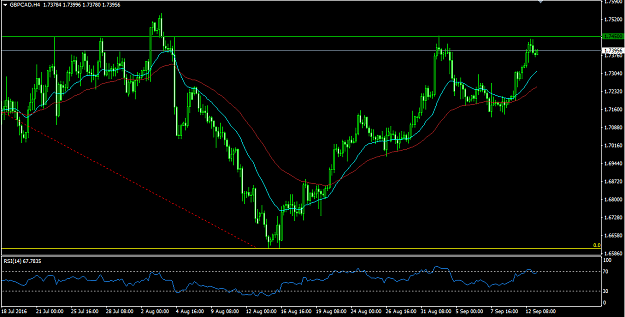
Fig: GBPCAD H4 Technical Chart
GBPCAD has built upon the bullish formation, after some corrective moves. Buyers have reigned in the market since mid-August and taken the pair considerably higher. The two MAs placed below the price action are fueling the bullish momentum but the resistance at 1.74500 should be watched closely, as the market has reversed from this
zone on multiple occasions previously
Trade suggestion
Buy Stop 1.74100, Take profit at 1.74500, Stop loss at 1.73660
SILVER
Fig: SILVER H4 Technical Chart
Silver is struggling around the major resistance level at 19.2000, and the upside currently seems limited as the two MAs placed above the price action, and are casting downward pressure on prices. The last three candles with long upper shadows and almost no lower shadows show strong but careful bulls moving cautiously when the price nears the key resistance level. The %K line has entered the overbought zone, and may cross through the %D line from above, signaling a possible pullback.
Trade suggestion
Sell Stop at 19.100, Take profit at 18.850, Stop loss at 19.400
WTI
Fig: WTI H4 Technical Chart
U.S crude prices continued to trade within the triangle formation, and have just pulled back from the upper boundary connecting lower lows since August 19. The 23.6% retracement level is within sight of the oil price. However, recently this level has been broken through quite easily. Therefore, if the bear can sustain its momentum, WTI may trader lower towards the lower boundary of the trading range.
Trade suggestion
Sell Stop at 45.80, Take profit at 45.00, Stop loss at 46.40
EURO50
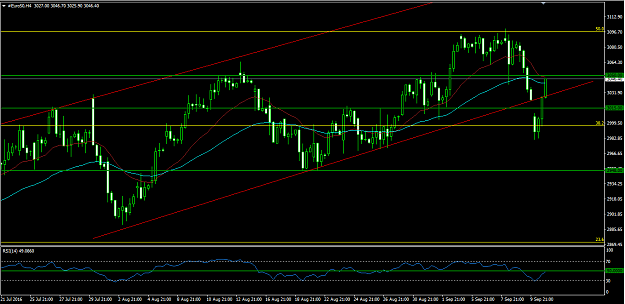
Fig: EuroStoxx50 H4 Technical Chart
Euro Stoxx 50 index rebounded from below the 38.2% level and broke back into the ascending trading range that has enveloped the recent price action. RSI has rallied from the oversold territory to near the 50 line. The resistance at 3050.00 is currently within sight of the price action. We should wait for the index to surpass this level before an uptrend can be confidently confirmed.
Trade suggestion
Buy Stop at 3050.00, Take profit at 3074.30, Stop loss at 3040.00
https://capitalstreetfx.com/en/wp-co...ort_footer.jpg
Daily Report on September 13, 2016
Asian shares edged up on Tuesday, taking their cue from European and U.S equities last night which shot up on the dovish comments from Federal Reserve Governor Lael Brainard. In a speech to the Chicago Council on Global Affairs, Brainard – one of six permanent voters on the Fed committee – stated that a labor market which is not-yet-at-full-employment and economic weakness abroad may demand more prudence in the move toward tighter Fed policy.
Brainard’s comments weakened the case for a September rate hike, triggering the recovery in stocks and weakening the U.S dollar.
Large Japanese manufacturers turned optimistic over the country’s business conditions in the third quarter, the joint survey by the Ministry of Finance and the Economic and Social Research Institute showed on Tuesday. The business survey index (BSI) which measures business sentiment among big manufacturers’ during the July-September period, came out at 2.9, beating expectations for a reading of -6.5.
The Australian dollar dipped slightly in early trade following comments from Reserve Bank of Australia assistant governor Christopher Kent on the need for a weaker currency. The central bank official said that the Aussie had not depreciated as much as expected in response to weaker commodity prices and cuts in interest rates that have brought the cash rate to a record low of 1.5%.
Australia’s biggest trading partner, China, is reporting some signs of recovery after some disappointments in July. Data from the National Bureau of Statistics indicated that factory output, investment and retail sales all exceeded forecasts. Industrial production rose by 6.3 percent from a year earlier in August, retail sales climbed 10.6 percent last month, compared to the same period last year while fixed-asset investment increased 8.1 percent year to date.
Technicals
EURJPY
Fig: EURJPY H4 Technical Chart
EURJPY generally has been on a decline from as high as 115.938. The short-term MA has just crossed over the long-term MA from above, consolidating the downtrend. Sellers are still overwhelming the market, suggesting more down moves which may push the pair to as low as 113.930.
Trade suggestion
Sell Stop at 114.400, Take profit at 113.930, Stop loss at 114.430
NZDUSD
Fig: NZDUSD H4 Technical Chart
After failed attempts to break above the 50% retracement at 0.74715, NZDUSD not only fell back into the ascending trading channel but also hit a more-than-one-week low at around 0.72898. The pair pulled back from the lower boundary of the channel and is currently facing firm resistance at 0.73420. Weakening bulls have failed to push the price past the MA20. The market remains in bearish territory. With the RSI pointing towards the oversold zone, further declines are expected.
Trade suggestion
Sell Stop at 0.73370, Take profit at 0.73110, Stop loss at 0.73650
GBPCAD
Fig: GBPCAD H4 Technical Chart
GBPCAD has built upon the bullish formation, after some corrective moves. Buyers have reigned in the market since mid-August and taken the pair considerably higher. The two MAs placed below the price action are fueling the bullish momentum but the resistance at 1.74500 should be watched closely, as the market has reversed from this
zone on multiple occasions previously
Trade suggestion
Buy Stop 1.74100, Take profit at 1.74500, Stop loss at 1.73660
SILVER
Fig: SILVER H4 Technical Chart
Silver is struggling around the major resistance level at 19.2000, and the upside currently seems limited as the two MAs placed above the price action, and are casting downward pressure on prices. The last three candles with long upper shadows and almost no lower shadows show strong but careful bulls moving cautiously when the price nears the key resistance level. The %K line has entered the overbought zone, and may cross through the %D line from above, signaling a possible pullback.
Trade suggestion
Sell Stop at 19.100, Take profit at 18.850, Stop loss at 19.400
WTI
Fig: WTI H4 Technical Chart
U.S crude prices continued to trade within the triangle formation, and have just pulled back from the upper boundary connecting lower lows since August 19. The 23.6% retracement level is within sight of the oil price. However, recently this level has been broken through quite easily. Therefore, if the bear can sustain its momentum, WTI may trader lower towards the lower boundary of the trading range.
Trade suggestion
Sell Stop at 45.80, Take profit at 45.00, Stop loss at 46.40
EURO50
Fig: EuroStoxx50 H4 Technical Chart
Euro Stoxx 50 index rebounded from below the 38.2% level and broke back into the ascending trading range that has enveloped the recent price action. RSI has rallied from the oversold territory to near the 50 line. The resistance at 3050.00 is currently within sight of the price action. We should wait for the index to surpass this level before an uptrend can be confidently confirmed.
Trade suggestion
Buy Stop at 3050.00, Take profit at 3074.30, Stop loss at 3040.00
https://capitalstreetfx.com/en/wp-co...ort_footer.jpg
Attached Image(s) (click to enlarge)