{quote} .... How much more is the bullish move? I have opened so many short positions and losing badly
Ignored
To effectively trap the market, we have to trade in line with the prevailing market trend. The overall market trend is up so we look to trade northwards. But looking for a most appropriate location, price and time; this may require an element of patience.
Trade safe and prosper.
KP
Do your homework, follow the footprints of smart money
{quote} Hi mate! I provide a technical perspective based on my swing trading system. Bulls were favored so were I to trade, I would look for a buy trading opportunity at some already identified level. As a matter of fact I had mapped an area on the H4 time frame where I look to trade from, I am just waiting for price to enter the zone. Trade safe and prosper.KP
Ignored
Thanks for the response. Unfortunately I am not good at technical analysis neither at drawing charts. Can I understand from you that you expect the bulls traders to continue the push beyond 1.3750 ?
{quote} Thanks for the response. Unfortunately I am not good at technical analysis neither at drawing charts. Can I understand from you that you expect the bulls traders to continue the push beyond 1.3750 ?
Ignored
Let me give you a tip that may help you. Place 100 and 200 SMAs on your M15 chart and see where the price is. If price trades above both SMAs, with 200 SMA below 100 SMA, trend is likely to be bullish; if the price is below the two SMAs with 200 SMA above 100 SMA, trend is likely to be bearish. But don't enter trade unless you see a good setup. If you need further tip in this direction, PM me.
Trade safe and prosper.
KP
Do your homework, follow the footprints of smart money
{quote} Let me give you a tip that may help you. Place 100 and 200 SMAs on your M15 chart and see where the price is. If price trades above both SMAs, with 200 SMA below 100 SMA, trend is likely to be bullish; if the price is below the two SMAs with 200 SMA above 100 SMA, trend is likely to be bearish. But don't enter trade unless you see a good setup. If you need further tip in this direction, PM me. Trade safe and prosper. KP
{quote} Hi mate! I provide a technical perspective based on my swing trading system. Bulls were favored so were I to trade, I would look for a buy trading opportunity at some already identified level. As a matter of fact I had mapped an area on the H4 time frame where I look to trade from, I am just waiting for price to enter the zone. Trade safe and prosper.KP
Ignored
As a swing trader, I am yet to trade this pair. The pair has not yet met my criteria. First, there is no momentum; second, the market has no clear direction; and third, price has not entered the trap I set. So, I am staying on the sideline.
KP
Do your homework, follow the footprints of smart money
{quote} As a swing trader, I am yet to trade this pair. The pair has not yet met my criteria. First, there is no momentum; second, the market has no clear direction; and third, price has not entered the trap I set. So, I am staying on the sideline. KP
Ignored
I got myself stuck with it for the time being but it's bound to correct. It can not keep going up indefinitely.
Joined Dec 2015
|
Status: Member
|7,916 Posts|
Online Now
You should make the most of demo accounts to learn how to better trap the market. Use demo accounts in a focused manner: to develop and master one or two functional trading systems/strategies and to learn solid risk and capital management. Avoid system-hopping and risky/aggressive trading.
Trade safe and prosper.
KP
Do your homework, follow the footprints of smart money
Do you swing trade? Do you trade on 4-hourly time frame or higher and hold trade positions longer than 4 hours? For consistent trading success, you will have to track, stalk and trap the market. The focus of this thread is to share ideas, experience, strategies and approaches that help trap or beat the market in short to medium-term swing trading, including trading on HTFs and holding positions longer than 4 hours if the TP target or market condition requires it. To define, watch, wait for, and trap the market is the heart of short term swing trading....
Ignored
Hey Keenpip,
Glad to find your thread man. I am developing a strategy that can stand the test of time myself without the use of any EAs. What i have in mind is a strategy with high win rate and low risk. I know nothing is impossible. Hope to learn more cos your strategy kinda fit mine too well . Am using weekly levels on 4hr time frame, I pull the trade on 4hrs only but i do overall analysis on daily and weekly. Hope to fine tune this strategy to reach my goal in mind.
{quote} Hey Keenpip, Glad to find your thread man. I am developing a strategy that can stand the test of time myself without the use of any EAs. What i have in mind is a strategy with high win rate and low risk. I know nothing is impossible. Hope to learn more cos your strategy kinda fit mine too well . Am using weekly levels on 4hr time frame, I pull the trade on 4hrs only but i do overall analysis on daily and weekly. Hope to fine tune this strategy to reach my goal in mind.
Ignored
Hi, mate! Sounds really cool. Using the weekly levels and getting setups on H4 time frame gives solid confidence in trend and swing trading. As you can see from my posts, particularly here and on weekly technical outlook, I use mainly MAs with price action. If you have time, you may post on this thread and we can share ideas and experience.
Trade safe and prosper.
KP
Do your homework, follow the footprints of smart money
Joined Dec 2015
|
Status: Member
|7,916 Posts|
Online Now
We all have to be mentally, emotionally and physically vital to trade well and trap the market imho. Do you agree with this? Do you have any experience to share on this?
Trade safe and prosper.
KP
Do your homework, follow the footprints of smart money
Joined Dec 2015
|
Status: Member
|7,916 Posts|
Online Now
If you are tracking AuDUSD, notice that the pair is pushing upwards towards an interesting S/R area, land marked by 0.7446 and 0.7505. A rejection of the zone southwards is likely to produce a turnaround for south bound trading; otherwise an upward break of the zone with H4 candlestick close above 0.7505 is likely to produce further interest among buyers.
I may be wrong. Trade safe and prosper.
KP
Do your homework, follow the footprints of smart money
Joined Dec 2015
|
Status: Member
|7,916 Posts|
Online Now
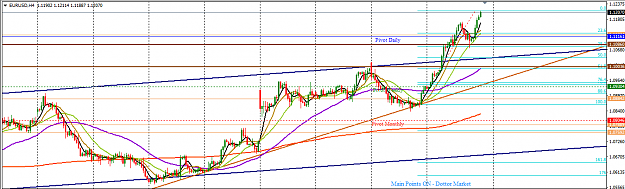
If you are tracking the EURUSD, you may find this technical perspective interesting. On the H4 time frame, buyers pushed price upward for the most part of last week and price broke above the channel resistance last week Tuesday. However, shortly after, the momentum slowed and on Thursday sellers tangled for a retracement before a further upward push. In the last two sessions on Friday, the upward momentum slowed down. Should sellers exert further pressure, price may retest the channel at an area that adjoins the 50/32.8 Fib retracement zone of the swing from the low of May 12, bounded by saddlebrown horizontal lines in the attached H4 chart. Otherwise, an upward continuation is likely to target the 1.14580 area.
I may be wrong. Trade safe and prosper.
KP
Attached Image (click to enlarge)
Do your homework, follow the footprints of smart money
Joined Dec 2015
|
Status: Member
|7,916 Posts|
Online Now
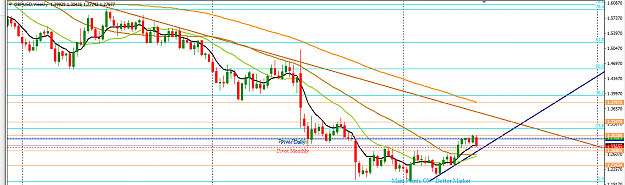
Here's a weekly technical outlook on the GBPUSD.
The pair has been primarily on the decline since April 2014. On the weekly time frame, price action is respecting a descending trendline (in chocolate colour) from the high of 2014. Price action in the past five weeks was sideways around a significant resistance zone and some pips shy of the 23.6 Fib retracement zone of the drop from the high of April 2014 to the low of 2017. Any northward move is likely to target the next resistance zone around the 1.33470 area. However, as last week’s candlestick is relatively bearish and bigger than the preceding candlestick – which was bullish – there is a possibility of a further southward move to at least test the ascending trendline (navy colour) from the low of January 2017, which is acting as the immediate support. A break of the trendline will expose the 1.23434 handle, which was the origin of a rally in April.
I may be wrong. Trade safe and prosper.
KP
Attached Image (click to enlarge)
Do your homework, follow the footprints of smart money
Joined Dec 2015
|
Status: Member
|7,916 Posts|
Online Now
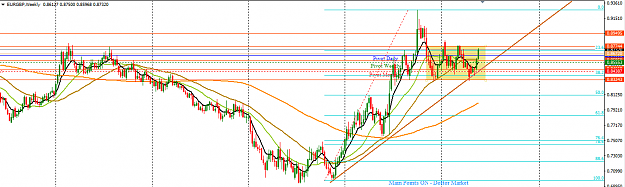
Here's a weekly technical outlook on EURGBP.
The pair has been mainly on an upward move since October 2015. On the weekly time frame, after a 32.8 Fib retracement of the swing from the low of October 2015 to the high of October 2016, price action entered a period of consolidation (indicated in the khaki coloured rectangle) and an ascending trendline from the low of October 2015 respected. Price action in the last two weeks saw the bulls in control, indicated by relatively big bullish candlesticks. As the price action last week was near the immediate resistance zone around the 0.87744 area, momentum for further upward move may be limited. However, should price action breach the area to the upside, the immediate target is likely to be around the 0.88550 area.
I may be wrong. Trade safe and prosper.
KP
Attached Image (click to enlarge)
Do your homework, follow the footprints of smart money
Joined Dec 2015
|
Status: Member
|7,916 Posts|
Online Now
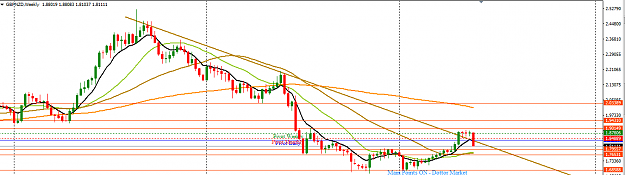
Here's a weekly technical outlook on GBPNZD.
The pair is on a descending mode. On the weekly time frame, a descending trendline from the high of August 2015 is respected by price action. Four weeks ago, price action paused in an area close to the trendline and was followed by two doji-like candlesticks which indicated a lack of upward commitment. Last week, a relatively big bearish candlestick was formed on the weekly time frame which further validated the descending trendline and gave credence to the intent of sellers to control the market. A likely target of a further bearish drive is the immediate support around the 1.79557 area.
I may be wrong. Trade safe and prosper.
KP
Attached Image (click to enlarge)
Do your homework, follow the footprints of smart money
Here's a weekly technical outlook on the GBPUSD. The pair has been primarily on the decline since April 2014. On the weekly time frame, price action is respecting a descending trendline (in chocolate colour) from the high of 2014. Price action in the past five weeks was sideways around a significant resistance zone and some pips shy of the 23.6 Fib retracement zone of the drop from the high of April 2014 to the low of 2017. Any northward move is likely to target the next resistance zone around the 1.33470 area. However, as last weeks candlestick...
Ignored
Do your homework, follow the footprints of smart money
Here's a weekly technical outlook on GBPNZD. The pair is on a descending mode. On the weekly time frame, a descending trendline from the high of August 2015 is respected by price action. Four weeks ago, price action paused in an area close to the trendline and was followed by two doji-like candlesticks which indicated a lack of upward commitment. Last week, a relatively big bearish candlestick was formed on the weekly time frame which further validated the descending trendline and gave credence to the intent of sellers to control the market. A likely...
Ignored
Do your homework, follow the footprints of smart money