S&P 500 analysis 26 April 2016
CHARTING
The crucial points are:
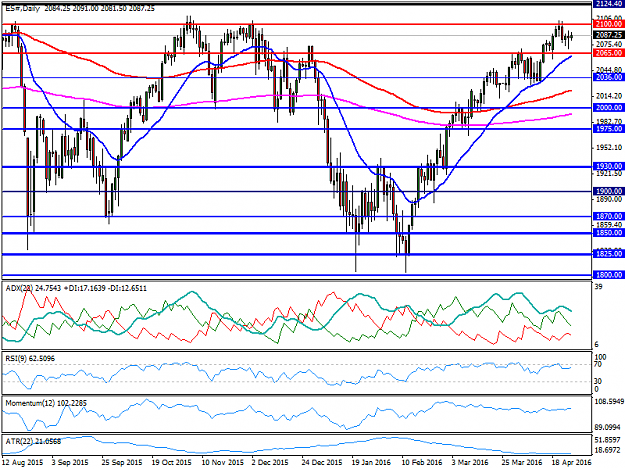
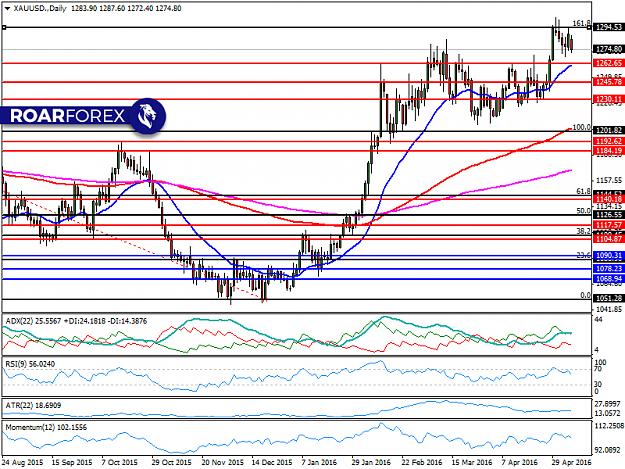
Fibonacci level monthly 100.0:669.09 61.8:1226.75 50.0:1298.05 38.2:1569.36 23.6:1780.07 00.0:2124.40
Resistance
2100
2065
2036
2000
1975
1930
Support
1900
1870
1850
1825
1800
INDICATORS
The crucial points are:
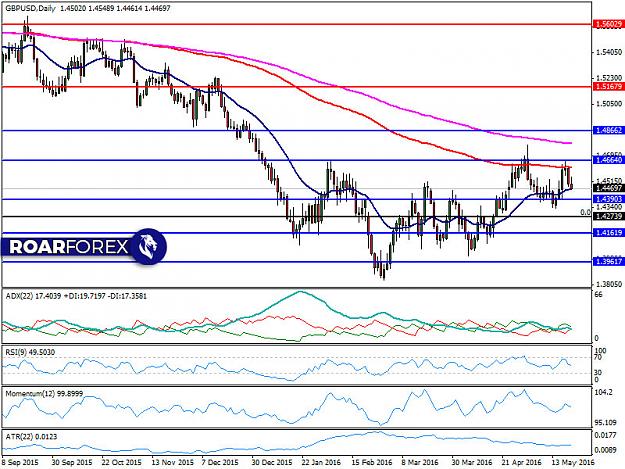
MA (22) strongly rising
MA (132) rising
MA (264) rising
Directional system (22) +DI>-DI or 17.16>12.65
ADX 24.75 falling < 25 occurs weak uptrend, which is possible to get weaker.
RSI (9) 62.50>50 overbought
Momentum (12) marginally rising
ATR (22) 21.0568 extremely low volatile market
In summary
The price is fluctuating, from the previous week, within the range 2100 and 2065, with lower volatility. The indicators continue to signal an uptrend, which now have falling dynamic and low volatility. On that level if the uptrend continues, the price must break strongly the 2100 level of resistance, with the next possible resistance level at 2124.40 (00.0 Fibonacci level as resistance). On the contrary, if a downtrend occurs, the price must break the 2065 level of support, with the next possible support at 2036 level.
Risk Disclosure
This forecast has just an informative meaning and cannot be treated as the guide to action, signal, recommendation or an offer to carry out certain trading operation. The experts of this blog express personal opinions and will not assume any responsibility whatsoever for the actions of the reader. We always aim for maximum accuracy, and RoarForex cannot be held responsible for inaccurate information or typos. Should you wish to participate in the FOREX market please be sure to contact the necessary professionals prior to starting to assess your personal financial situation.
For more information, please go to our website: www.roarforex.com
CHARTING
The crucial points are:
Fibonacci level monthly 100.0:669.09 61.8:1226.75 50.0:1298.05 38.2:1569.36 23.6:1780.07 00.0:2124.40
Resistance
2100
2065
2036
2000
1975
1930
Support
1900
1870
1850
1825
1800
INDICATORS
The crucial points are:
MA (22) strongly rising
MA (132) rising
MA (264) rising
Directional system (22) +DI>-DI or 17.16>12.65
ADX 24.75 falling < 25 occurs weak uptrend, which is possible to get weaker.
RSI (9) 62.50>50 overbought
Momentum (12) marginally rising
ATR (22) 21.0568 extremely low volatile market
In summary
The price is fluctuating, from the previous week, within the range 2100 and 2065, with lower volatility. The indicators continue to signal an uptrend, which now have falling dynamic and low volatility. On that level if the uptrend continues, the price must break strongly the 2100 level of resistance, with the next possible resistance level at 2124.40 (00.0 Fibonacci level as resistance). On the contrary, if a downtrend occurs, the price must break the 2065 level of support, with the next possible support at 2036 level.
Risk Disclosure
This forecast has just an informative meaning and cannot be treated as the guide to action, signal, recommendation or an offer to carry out certain trading operation. The experts of this blog express personal opinions and will not assume any responsibility whatsoever for the actions of the reader. We always aim for maximum accuracy, and RoarForex cannot be held responsible for inaccurate information or typos. Should you wish to participate in the FOREX market please be sure to contact the necessary professionals prior to starting to assess your personal financial situation.
For more information, please go to our website: www.roarforex.com
Attached Image (click to enlarge)