Hi guys,
One of my traders doubled his live account in 1 month with 7% drawdown based on a simple strategy called the breakout pullback strategy. If anyone wants to see his live account trading statement, you can view it here : Breakout Pullback Strategy
I'll be using this thread to come up with various trading examples. It is based on a 5 minute chart. Here's one to begin with :
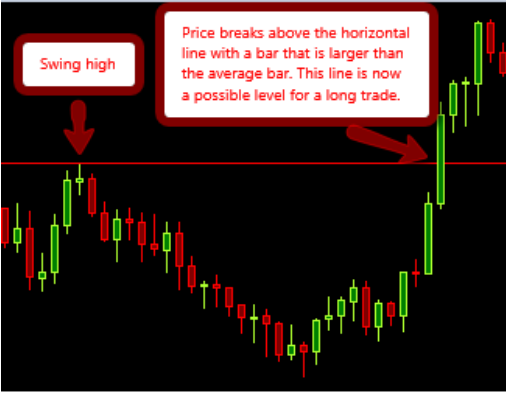
This is a simple breakout :
These is an example of a pullback :
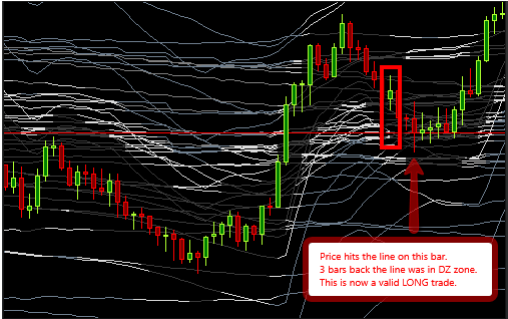
The "DZ Zone" is simply a zone identified by the TFA Sniper where the chances of retracement is very high. Anyway, this is a normal version of the strategy and most people would buy here. But for our strategy, we are going to add 2 additional factors that greatly increases the chances of profitability, one for areas of support/resistance and one for determining the market momentum :
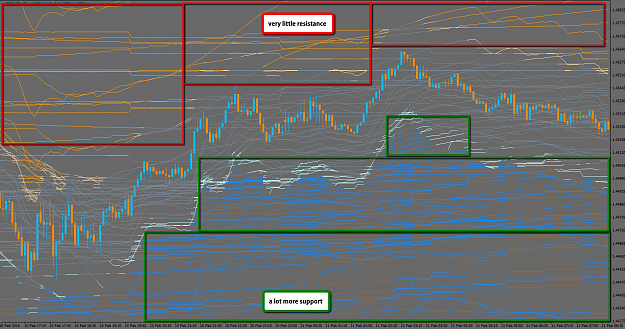
Advanced Fibonacci Waves to determine the areas of support/resistance (basically you don't want to be selling into support or buying into resistance) :
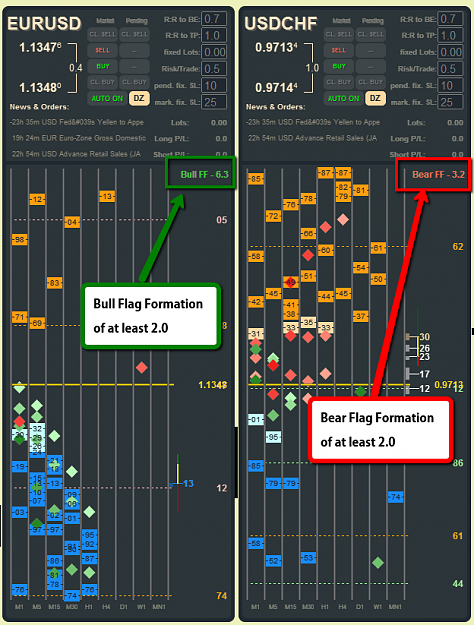
TFA Sniper Flag Formation Filter (basically you want to be buying when there's bullish momentum and selling when there's bearish momentum for that currency pair) :
Now when you combine all these factors, you get a very high probability trade because you utilize chart patterns, momentum analysis, advanced fibonacci support/resistance, elliott wave theory (explained in post above). This gives you a very holistic approach to entering at the correct point of entry.
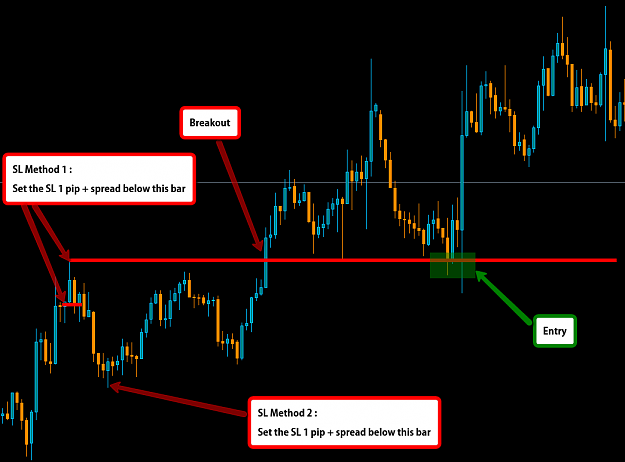
Stop loss methods are very simple and is basically on the level of the breakout or at the swing low/high before the breakout :
That's all to it folks. A really simple way to trading the market and being profitable. I'll be posting more examples here as time goes by
Here's the more detailed guide to this strategy : Breakout Pullback Strategy
Cheers,
Dezzy
One of my traders doubled his live account in 1 month with 7% drawdown based on a simple strategy called the breakout pullback strategy. If anyone wants to see his live account trading statement, you can view it here : Breakout Pullback Strategy
I'll be using this thread to come up with various trading examples. It is based on a 5 minute chart. Here's one to begin with :
This is a simple breakout :
Attached Image
These is an example of a pullback :
Attached Image
The "DZ Zone" is simply a zone identified by the TFA Sniper where the chances of retracement is very high. Anyway, this is a normal version of the strategy and most people would buy here. But for our strategy, we are going to add 2 additional factors that greatly increases the chances of profitability, one for areas of support/resistance and one for determining the market momentum :
Advanced Fibonacci Waves to determine the areas of support/resistance (basically you don't want to be selling into support or buying into resistance) :
Attached Image (click to enlarge)
TFA Sniper Flag Formation Filter (basically you want to be buying when there's bullish momentum and selling when there's bearish momentum for that currency pair) :
Attached Image (click to enlarge)
Now when you combine all these factors, you get a very high probability trade because you utilize chart patterns, momentum analysis, advanced fibonacci support/resistance, elliott wave theory (explained in post above). This gives you a very holistic approach to entering at the correct point of entry.
Stop loss methods are very simple and is basically on the level of the breakout or at the swing low/high before the breakout :
Attached Image (click to enlarge)
That's all to it folks. A really simple way to trading the market and being profitable. I'll be posting more examples here as time goes by
Here's the more detailed guide to this strategy : Breakout Pullback Strategy
Cheers,
Dezzy