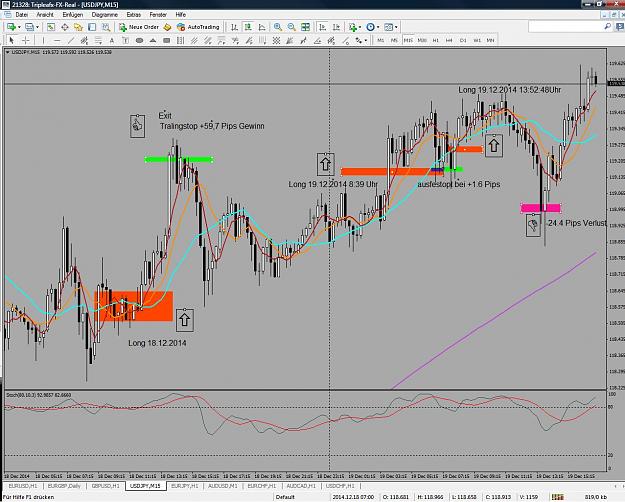
Good morning folks,
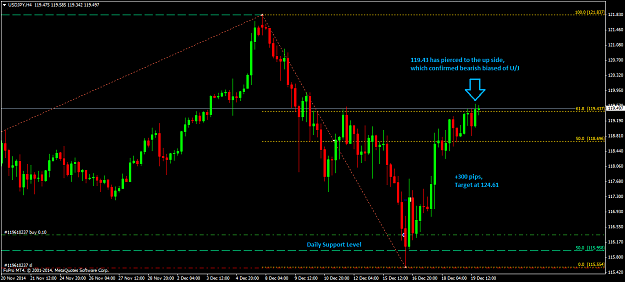
My Sl was hit on the sell when it broke 119.54 and i lost 1.5% .. No worries but now, i am also bullish. My count was wrong. It was only a 3 wave retracement. My belief was confirmed when DXY broke the december high as well. It seems well on the way to 128.++. some resistance at 124 which was the previous high and then on the way again. This seems to go well with the count i have changed in Nikkei 225 which has a strong correlation with UJ.
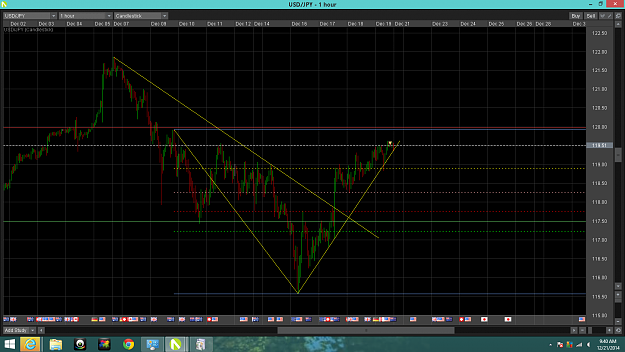
The present condition could have a retrace as 1 hr and 4 hr is in overbought levels.
Not the same with us dollar index (dxy), although it broke the december high, i am still not convinced it's going a lot higher. The fib ratio convergence does imply that a reversal is due in the short term. Similar is the case with Eur/Usd, breaking the december low allows it to go a tad lower to 1.2190 from current levels and then up again. A five wave pattern completion is very close.
I am still holding a EU buy (.2lot) and a GU (.1) buy.
Gu on the other hand is still ranging on an a-b-c-d-e 4 th wave .. upside is limited to 1.5760 and then a strong move to the downside for wave 5 to 1.5390.
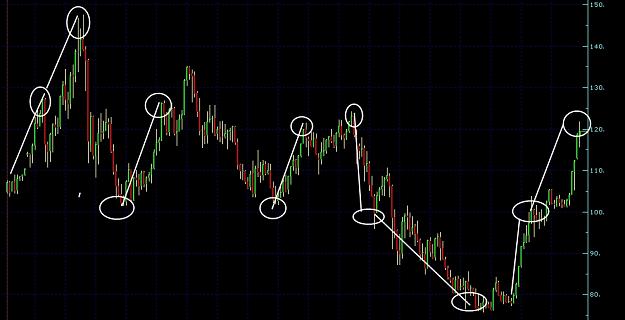
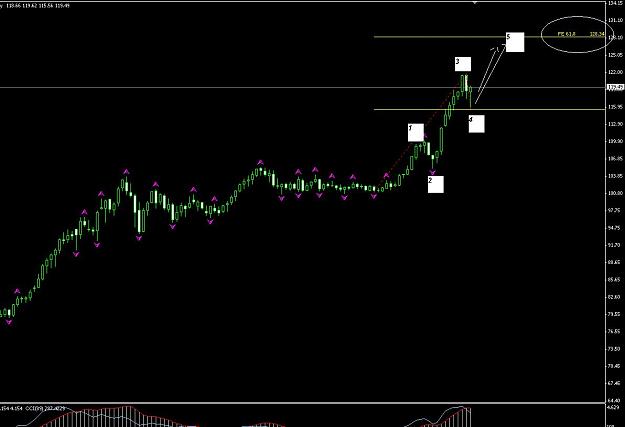
weekly chart of Uj.
This is my view and can change, I have been wrong many times like the last one, so please trade safe.
Weekly chart of UJ is inserted.
I have recently started a blog which you can find in my profile. I don't want to clutter this place with charts of other pairs, so those of you interested in other pairs which i trade, can check it.
Safe trading.....
My Sl was hit on the sell when it broke 119.54 and i lost 1.5% ..
The present condition could have a retrace as 1 hr and 4 hr is in overbought levels.
Not the same with us dollar index (dxy), although it broke the december high, i am still not convinced it's going a lot higher. The fib ratio convergence does imply that a reversal is due in the short term. Similar is the case with Eur/Usd, breaking the december low allows it to go a tad lower to 1.2190 from current levels and then up again. A five wave pattern completion is very close.
I am still holding a EU buy (.2lot) and a GU (.1) buy.
Gu on the other hand is still ranging on an a-b-c-d-e 4 th wave .. upside is limited to 1.5760 and then a strong move to the downside for wave 5 to 1.5390.
weekly chart of Uj.
This is my view and can change, I have been wrong many times like the last one, so please trade safe.
Weekly chart of UJ is inserted.
I have recently started a blog which you can find in my profile. I don't want to clutter this place with charts of other pairs, so those of you interested in other pairs which i trade, can check it.
Safe trading.....
Attached Image (click to enlarge)
STING