{quote} hello sinqua and welcome... i checked your profile and see that u're based in South Korea, so from your joyful reaction i take it u are a fellow countryman. i have a friend from the BoKaap in Cape Town whose son is a geologist {should be about your age} and who married a South Korean beauty [never had the pleasure of making her acquaintance though] ...u are not perchance that son ???
Ignored
Sadly not, I'm not even South African, I know a few though, nice people.
i have a question for you.According to your first strategy you mentioned that "Monthly is Up" means monthly chart trend up or current month candle is bullish ??? thanks
Hi sunshine, how r u? Im reading your thread, its interesting but to be honest i dont get it I dont understand several things, like jumping from M TF to Daily? (skipping W TF) and/or move from W to H4? (skipping Daily FT) ...why??? ...or why 1 buy (sell) signal is good and other not (u still didnt explained difference between yellow & red "x") I agree more with opinion of Palabara, what he said, but as i still dont know what is your sistem about, i will let u to explain it more, but here (if u dont mind) i will show some exmples of Cable So...
Ignored
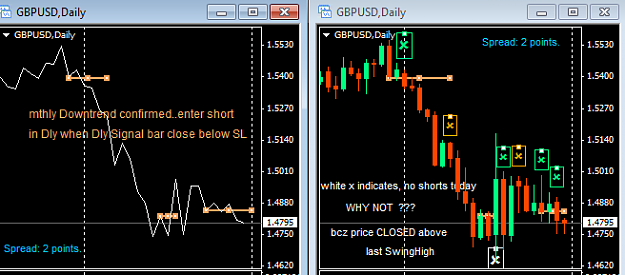
If we have a preference for trading the Daily chart because we are working or can't stand stand being glued to the screen, then we look at Monthly overall direction...i.e...which way points the slope of the Mthly time frame ... does it slope Upwards or Down ...?
in your example of the GBPUSD, the mthly slope is down, correct ? here follows the strategy of my method::
we drop down to the Daily and look for Trading Signals there, once we found what we looking for then we enter short with a Stop above the Daily Signal Candle High.
NOTE:: we don't bother to look at the Weekly or the 4hr. u say that we may be stopped out by a rally from either the 4hr or Weekly...yes, that might happen...so what ? If we can't take that Loss then it means our trade size or lot size is way above our comfort zone...look at my trade size...i can take every and all signals i choose because, for my account size, that's what i feel comfortable with...i can sleep even should i be stopped out like what happened last nite to some of my trades. the intention is that our trade size will increase as our account size increase....slowly but surely...no rush here.
below i'm showing the Daily Line chart and the Daily Candle Chart with explanations on them. Just for the record, the 2 candles after the white x reversal candle will tell me to leave that pair alone for now...there is no follow thru...no momentum. we don't just take blindly all signals as u can see...if we entered 2 times and the trades doesn't work out, then we stand aside...no need to force the issue.
as i explained to palabara, i can't be bothered about certain things that will cause me to become immobile...fibo's , golden ratio's, harmonics, the phases of the moon, the tea leaves in a tea cup or the movements of the planets or the hooting of an owl...those things are not for me...i'm sure u heard of ..."paralysis from over analysis..."you will find in this forum brilliant technical analysts and brilliant fundamentalist, but giving advice or information on one hand and trading your own advice on the other hand are two entirely different things...that is what is called...you talk a great talk but can u walk your your talk...? that is what i am doing here...i'm walking my talk. in an open an transparent way by virtue of my Trade Explore
Hi sunshine, i have a question for you.According to your first strategy you mentioned that "Monthly is Up" means monthly chart trend up or current month candle is bullish ??? thanks
Ignored
Yes supa , overall chart trend or slope, bullish monthly candle is a bonus.
that is why i posted a LINE chart of the Monthly first and not a Bar or Candle chart. u approach your analysis with a LINE chart first, then switch to the chart format u prefer.
new month, new beginnings...just like a trade...each trade stand on it's own and is managed and treated as such.
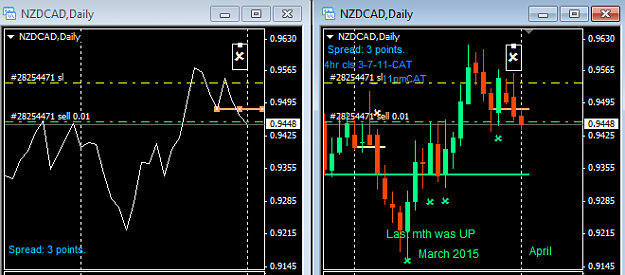
Last nite some trades were taken out yet again, this time it appears the overall result was a gain in the balance of the trading account. Late yesterday, Central African Time/Central European Time, entered a short on USOIL off the 4hr+weekly charts...still in a minor loss. A few minutes ago in the NZDCAD, i took a short off the Daily tf signal, please see the 2xDaily charts below, showing,
a Dailyclose below last Swing Low thus permitting shorts.
the next Daily chart shows more clearly which bar gave the trade signal.
also note placement of the stop
although i shorted this pair, the TREND of Monthly is still UP, why ? because the DAILY candle closed BELOW the last Swing Low...if not clear then please look at the LINE chart below and u may also ask me, stating what exactly u don't understand.
Lastly, the trade may result in a gain OR a Loss, except that fact and make peace with it before u initiate any position. If u can't accept a pip loss that big than know that your trade size is much too large for your account size should u be looking at Swing or Position Trading.
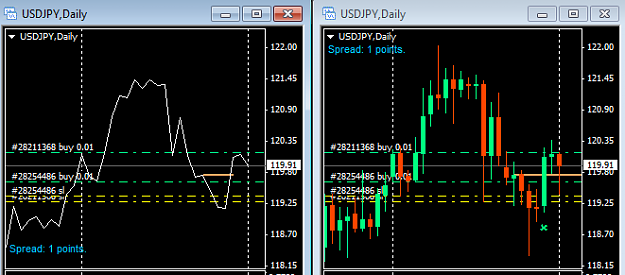
and here are two Daily charts of the USDJPY pair. u can see 2 long trades on them, the one was entered after that long bullish candle completed, i was anticipating a possible retrace but i could not be sure so i entered rather then stand a chance missing its run north should there no retrace. Anyway, a bit earlier today i bought into that pullback of the retracement. it made its deep retrace and i bought around the 50% mark on its pullback . Please take note of my SL...it is small so it could be taken out today but i don't think so.
Please Note: each trade is entered on its own criteria and each trade is managed accordingly.
the GBPJPY failed to close below its monthly swing low and the Daily confirmed longs are in order, i do not have a position in it yet. are there anyone that are uncertain about a pair or commodity or needs confirmation on trade direction ? ask here please.
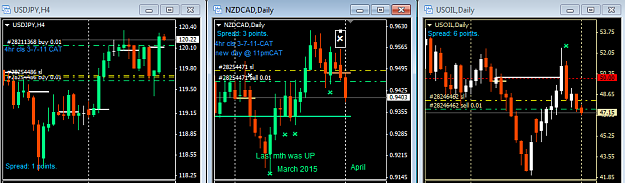
moved Stops to just above Daily Open bar of NZDCAD & USOil and in the case of USDJPY trade of this morning, moved SL to just below last long bullish 4hr bar. i'm reasoning that should price move back to its starting points of today then i don't want to know them, therefore should that happen then at least i've considerately lowered my risks on these trade. See the respective charts below.
NOTE: i am posting these charts as LIVE real time examples AND as learning aids for those that which to learn. Please take them in that spirit. Some feedback will be appreciated as i will not move ahead unless i see some progress in understanding and participation. Again, i am requesting those interested in trying out this method to open at least a new demo account and attach its trade explorer , make everything visible to the public as i have done with mine, and more importantly...start with a 1,000 USD on demo or the amount that u intend on starting live with so that your mind can get used to the dollar amounts and pips.
Hi Traders, below is an extract of a pm discussion with one of our members, if u are interested to learn than please read below.
"...about my trading account, don't be discouraged by my results thus far, that is normal for all new trading accounts that i start. by that i mean...the account balance hovers around positive and negative for a while until it takes upwards, once that happen u should see how the account multiplies.
Please keep this in mind, in my other accounts i traded sometimes intra day, whereas here i wish to stick to the method that i'm presenting, and this method as i stated in the beginning of this thread is a TREND FOLLOWING method which by definition means we try to catch the BIG trend as it starts and then ride it until it shows signs of exhaustion, along the way we will pyramid to gain as much as possible.
one mistake i've made the other day is when initiating a trade against the main trade i should monitor it during that specific trading day, for example...if the monthly trend is up but the Daily gives a signal that shorting is in order and i then enter short...i should monitor that trade on-and-off during the day and move SL to break even once a safe distance away, say 50 or so pips, from entry point...that's what i neglected to do and also neglected to mention in the thread.
Can you tell me if u understand what i'm trying to convey ? If u understand, fine...if u don't understand, then please tell me what specifically u don't understand..."
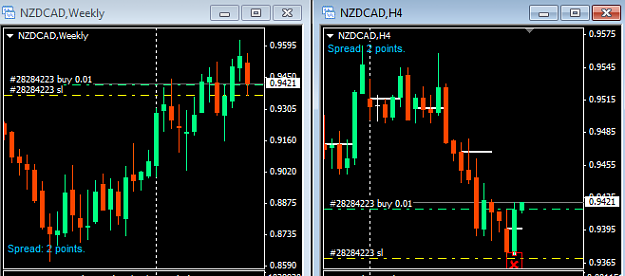
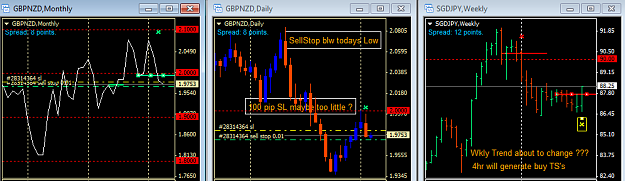
entered a buy this morning based on the 4hr chart BUY TS.
humour me for a moment please
what am i trying to do here ???
i am trying to catch the Weekly UP Trend,
by entering on the WICK or tail or pinbar {once that weekly price reverses it will form a wick of which the opening price is about 100 pips above...can u see the potential ???}
for that to happen...it is a must that the current Weekly bar or candle must retrace, therefore, we want to see a current weekly bar that is RED !!!
i have never said my method is easy, i did say that the entries are most difficult to do...why ??? because we enter when there's blood on the streets... to see the red blood [candles] just have a look at the 4hr chart and u will see what i mean,
from hard gained experienceand not academic discussion and grandstanding, that wick entry is best achieved by watching the 4hr chart for a BUY signal then once a TS arrived and completed, i enter long
is it clear anyone, please tell us if u have difficulty assimilating my practice, thanks
for vivid explanation, see the Weekly chart below that indicates the UP TREND, and the 4hr charts that that shows the TS.
o, moving on...i really want at least one member to grasp my method
as for the above post, it is entirely possible for price to reverse against our long entry...so what ? ...it's just rinse and repeat...that's all. please note my wording here, i am saying that price may reverse against the long entry...i'm NOT saying...price reverses against me or us... remove yourself from the equation and your mindset and u will remove your personal feelings and psyche from being injured, damaged, demoralised and demonised please...
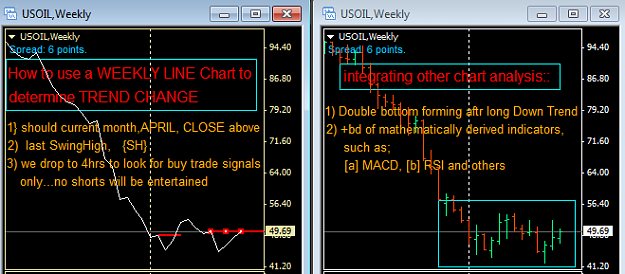
let us take a look at the Oil chart so as to position ourselves and our trading perception as to which way we can look forward to trade on an intermediate to long term basis as from next week.
EDIT: i am aware that some "respected" industry bigwigs, analysts and large banksters are forecasting oil prices as low as $20 and some even lower to $10. i approach these forecasts in this manner:
i throw their forecast into my own filters,
then i look to see whether their forecast agree with my own,
if they agree then ok, if they don't agree then i throw their forecasts out and just trade what my charts tell me, it never fails.
in addition to that, i note what industry specialists are saying about the fundamentals,
i note what economic hitmen are doing to different countries that the prevailing world bully doesn't agree with, whether it is to immerse that target countries into enslaving debt or regime change or regional unrest or out right war or war mongering or sanctions in the "interest of protecting their political and economic interest".
bottom line: i am aware of outside happenings outside of my charts, but the footprints of these happenings are clearly visible on my charts, so i trade my charts and not slavishly follow the forecast of someone who talks his books or funds holdings.
we pull up the weekly LINE chart of USOIL...remember, we always approach our analysis with a line chart first then only after that we switch to bar or candle or whatever chart format u prefer. there are 2 x Weekly Charts below in different formats, the Line Chart and the Bar Chart.
the Week is not finish yet but i put a preliminary analysis of the weekly anyway to serve as sort of heads-up should u have any positions currently.
any other analysis to concur or disagree are most welcome, thank you.
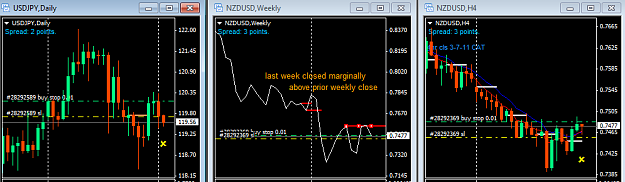
nothing to add to the USDJPY, everyone that follows this thread knows our Long term bias. The chart for the Kiwi Longterm chart and reason behind initiating a BuyStop for it are also below
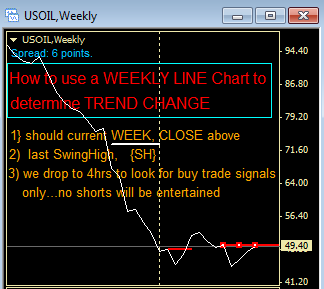
CORRECTION of error on WEEKLY OIL chart of POST 55:
i apologise for that.
The weekly line chart please refers to item 1 which contains incorrect time frame reference; item 1 reference the current month of April instead of the current week of which today is the last trading day. please see Weekly Chart of OIL below with correct tf reference. i have underlined the correction.
Learning from my trading mistakes: Traders and interested parties , please learn from my mistakes, you will make your own but no need to repeat mine.
a few unnecessary SL's were activated since this thread went live with it's accompanying trade explorer. i am mentioning some below...this note is firstly directed to myself.
Trading Mistakes committed:
4hrs tf:: 50 pip or SL below prior ts bar...when a TS is generated by the 4hr tf, because less than that results in trades to be whipped sawed before resuming initial trade direction, i.e. we would have been in profits, latest example is the BuyStop that was placed yesterday on the NZDUSD and got activated but then the very next 4hr bar stopped out the trade that would have been profitable right now...so lesson learned...SL should have been 50 pips or below the last 4hr bar and the long trade would have succeeded up till now...but this is also a counter trend trade and should not have been placed unless i could watch it intraday. the only time we make an exception to this rule is when we are already in a trade and now we entered a 2nd trade in the same direction but price is still close to our previous entry.
Daily tf:: 100pip...Stop Loss is needed when Trade Signals are generated by the Daily tf or when previous Daily bar range exceeds 100 pips.
leave the SL in place for at least 2 bars if the trade is taken in the direction of the higher tf {dly+mthly}
counter trend trades will be managed intraday, for example...trend= m+d=UP; so a Dly Line chart give a TS for shorting...this ts will essentially be against the higher time frame trend, should we now decide to take this sell ct trade then it is imperative that we monitor it right throughout the trading day and once price is a "safe" distance away we can move SL to breakeven or below. ALSO, we may close this trade should our reading of intraday price action tells us so. NOTE: this intraday monitoring of price action is reserved for later live lessons and examples, depending on interaction from interested parties of this thread.
Lastly, i have to forget about my live explorer and just trade as usual...i found that the knowledge that others are observing my actions make me loose trading focus a bit and changing my trading method subtly as in putting to close a SL and just generally worry about my trading performance...now i can understand what scientist meant when they concluded and i quote and paraphrase..."...the very act of observation causes the result to change..."
I have been following this thread with interest. And thanks for sharing your knowledge. If u don't mind, can u pls check my understanding of what u posted are correct?
Can I summarise your trading method.
Q1) You are using the LINE graph to better visualize in seeing basically 2 things being namely the
MOST CURRENT TREND based on month or week by using the SLOPE of the LINE.
All the BIG & SMALL SWINGS HIGH/LOW
Q2) You then trade the BREAKOUT of the MOST RECENT PREVIOUS SWING pertaining only to the direction of the MOST CURRENT TREND as defined in month/week
Q3) Because of using LINE CLOSE prices do u take trades while price is still developing or wait for H4 bars or D1 bars to close?
Q4) How do u react during price swings of consolidation. I mean Swings High/Low are very close together. They trigger multiple entries.
Q5)How do you pyramid? Is it based on those small LINE SWINGS also in lower TF Daily or H4 or just based on +brb (long) / -brb bars (short) or fixed pips?
Q6) When do u TP or close all your pyramid positions? Based off those LINE SWINGS again on higher TF or lower TF?
Q7) Lastly a dumb question, is there any difference in using LINE OPEN price (1 EMA Open) instead of CLOSE prices to make decision except it will be slower? Open Prices remain stagnant while close prices tend to move in real time. I ask because recently FF threads all starting talking about trading using OPEN prices. Pls pardon me if it sounds stupid.