Please excuse the PO trade, I was trying to see if I can enter a pending sell order above the current market price.
Sadly, I cannot, however the trade ended up getting placed in an appropriate spot anyhow, so I left it.
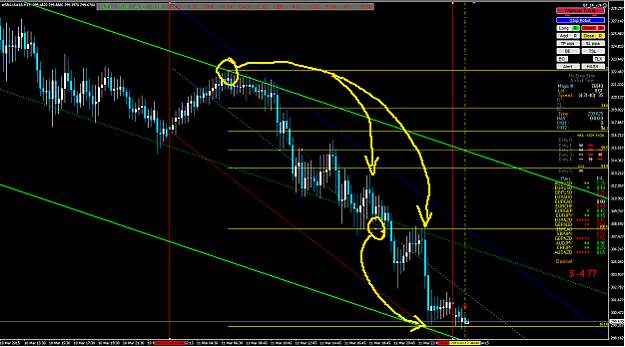
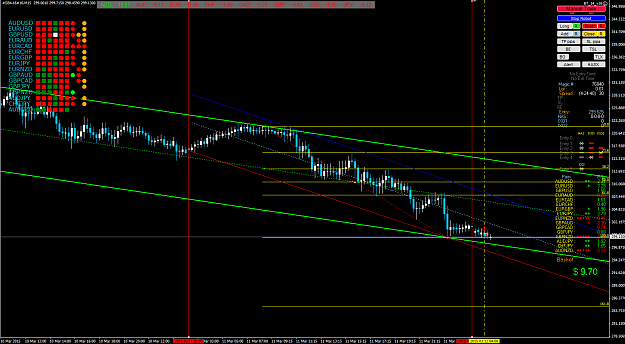
IMO You have two good choices for drawing fibs for the day, reason being because the price action has been very fickle during this asian session.
The top anchor can be at either the first top arrow for a more coservative approach, or the second top arrow for a more aggressive approach.
I've chosen to base my trades off of the second arrow. The bottom arrow is the low before the asian open and thus is the only option.
|
Commercial Member
|
Joined Nov 2013
|4,947 Posts
Quote
Disliked
IMO You have two good choices for drawing fibs for the day, reason being because the price action has been very fickle during this asian session.
The top anchor can be at either the first top arrow for a more coservative approach, or the second top arrow for a more aggressive approach.
I've chosen to base my trades off of the second arrow. The bottom arrow is the low before the asian open and thus is the only option.
Thanks for the feedback i thought so.
It broke the 161 so is the aim now 261 or do you follow the trade and start using additional "sub" fibs from here on ?
Perhaps just to set a SL.
Btw for fun. I made $10 an hour, upgraded to burgerflipper i think.
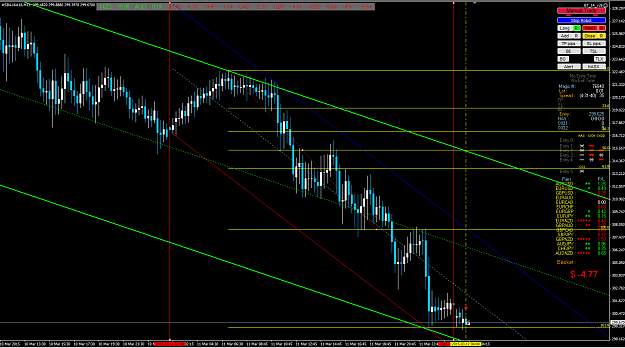
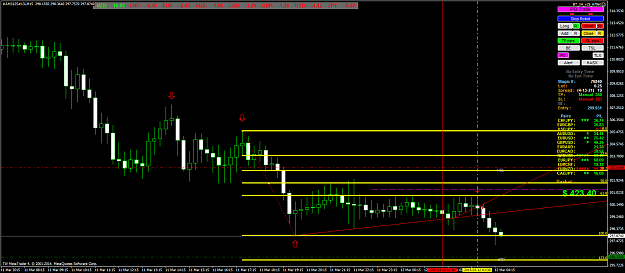
Don not use them normally only channels so Fibs ? Or is it the somewhat lower spike up midway previous session ? {image}
Ignored
Hey HotPotato,
Unless that's an old fib drawing, your 161.8% should not be where it is in your picture.
That is only an extension, you should only see it when price start selling off and nearing it.
I've attached a picture showing where your fib anchor points should be.
Their is only one option for the bottom anchor point, but you have at least two viable options for the top anchor point,
depending on how aggressive your feeling
Also, if your trading based off of Fibs, you want to wait for price to test a fib line from the bottom, in the case of a bearish trend,
or test it from the top, in case of a bullish trend.
I hope this picture is clear to understand, I did it on microsoft paint, lol
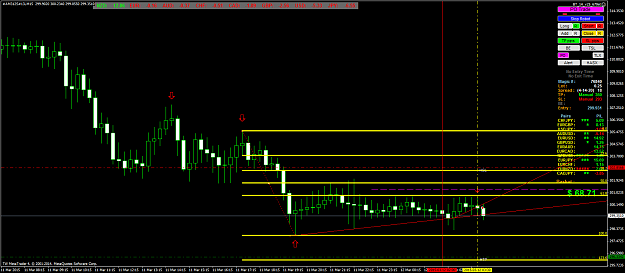
{quote} Thanks for the feedback i thought so. It broke the 161 so is the aim now 261 or do you follow the trade and start using additional "sub" fibs from here on ? Perhaps just to set a SL. Btw for fun. I made $10 an hour, upgraded to burgerflipper i think. {image}
Ignored
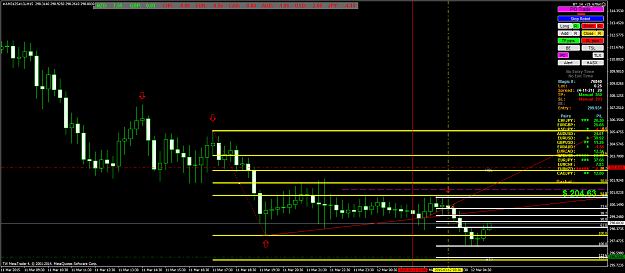
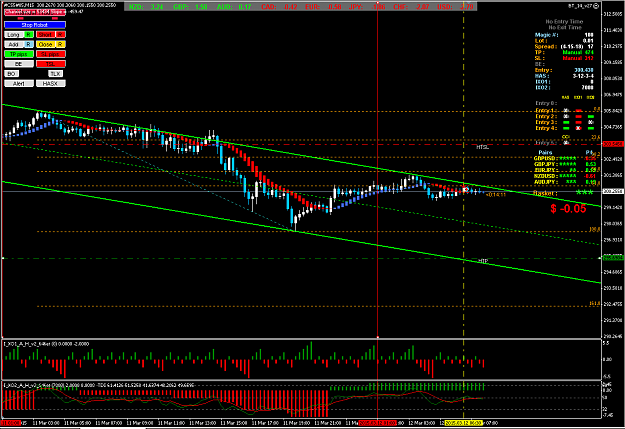
Here's mine so far, I'm once again debating whether to move my take profit to the 161.8% or "wisely take" 123.6% profits, lol
|
Commercial Member
|
Joined Nov 2013
|4,947 Posts
Trade should have been a BO or PO.
Will study on your "paint artwork"
I found it interesting that the fib lines almost matched the shi and trend trade channel crosses both generated on the same time kopratasa locked the screen.
Everything comes together.
|
Commercial Member
|
Joined Nov 2013
|4,947 Posts
Mmmm, why is the 123 level missing on the standard mt4 fibo.
Quote
Disliked
Unless that's an old fib drawing, your 161.8% should not be where it is in your picture.
That is only an extension, you should only see it when price start selling off and nearing it.
I hope this picture is clear to understand, I did it on microsoft paint, lol
No, I do not use trailing stops because
I have yet to see the use of any reasonable trailing stop to increase the overall profiting ability
when using fibs as your entry.
One reason is because most reversals, especially using baskets, happen off of the 123.6%, 161.8% and every now and then the 100% fib.
So why not just exit at that time when the opportunity arises?
Why wait for price to go against you before you exit?
Another reason is that frequently trades retrace, and they usually will retrace right until the 50% or 38% of the secondary trend that
you entered into. Any reasonable trailing stop would be hit by that time.
(Take a look at my active trade right now, look at the white fibs on the right showing the small retrace, any tight trailing stop would be hit
already, however the party hasn't even started yet...lol)
However that is not the time to be closing your trade, if anything you should be adding at that point, because usually the market
will start moving back into the direction your trade was in quite quickly and take out old extremes, but if you were using a trailing
stop, you would have missed out.
Unless your trailing is really far away, in which case it isn't necessary because if their is
that much volatility to take it out, the market would likely already have taken out your 123.6% fib target with a wick or two.
Closed today's trade, price action got really close to the target then decided to start messing around, so I closed it a couple pips above it. Time for bed {image}
Ignored
Hi Collbudz223,
Learning the fibo drawing on C5 basket. is it correct ?
it on 61 level so it should short and target is 128 level .
|
Commercial Member
|
Joined Nov 2013
|4,947 Posts
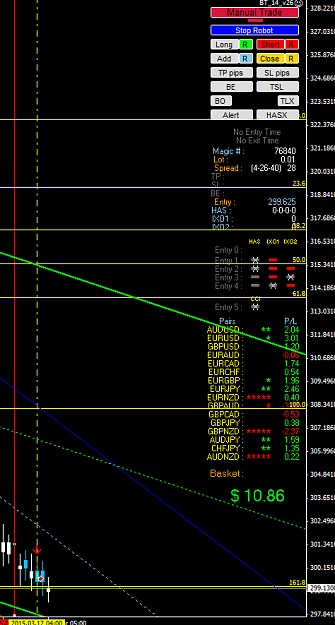
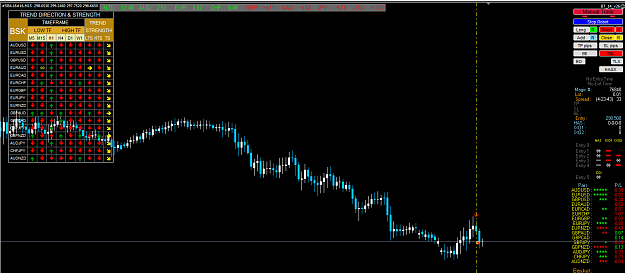
New indicator for the BT trade screen.
Keep an eye on the pairs in the basket and if one doesn't play nice you can close the trade.
Comes with the next release.
New indicator for the BT trade screen. Keep an eye on the pairs in the basket and if one doesn't play nice you can close the trade. Comes with the next release. {image}
sorry, I'm a little lost, some step not performed well, generating the basket, this does not appear in "open offline" basket appears in the "files" folder but do not like to appear on the open offline folder.
thank you very much for everything.
New indicator for the BT trade screen. Keep an eye on the pairs in the basket and if one doesn't play nice you can close the trade. Comes with the next release. {image}
|
Commercial Member
|
Joined Nov 2013
|4,947 Posts
I am releasing the Basket MTF indicator for testing.
if after loading the indicator interferes with you chart, double click (left mouse button) on the left top of the outer border and a small white box should appear.
Click (left mouse button), hold and drag the box to another place on your chart and release mouse.
VMC Can you post your S&R indi with the single line instead of the box here. I have the source but why program if you do not need to.
Ignored
Good morning HP,
Today I'm late for the trading day...... will have to wait for new opportunities to develop. Let's see what shows up.
Regarding the SnR indie, I use the SS_SupportResistence_v04c, but I only have the "ex4" file... which I think won't do for what you need.
Nevertheless, I always do SnR manually as well (the old fashioned way) because I find that the indies sometimes don't show all they should.
Sorry I couldn't be of help this time...
I haven't installed the new BDM & Kopra files on my MT4 platform yet, because I have a CCI trade running for some days and I can't shutdown the BTEA... so I will have to wait a bit more...
I am releasing the Basket MTF indicator for testing. if after loading the indicator interferes with you chart, double click (left mouse button) on the left top of the outer border and a small white box should appear. Click (left mouse button), hold and drag the box to another place on your chart and release mouse. Or move it for clarity. {file} {image} {image}
Ignored
Fantastic Tool once again! I keep looking forward to your comms because they just come in with glad tidings!
Glad to know that the ideas just keep coming to you when you are not standing under the shower