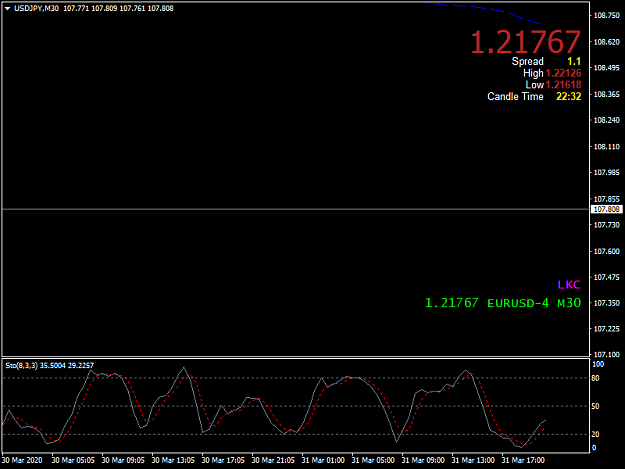
Disliked{quote} Hiya @Qeju I just noticed something when I tried to check the interesting fact you mentioned. I see the is chart different as below: {image} Again I added the TDI classic one below: {image} I have noticed that regarding Synergy-pro-TDI, I see it in the 00:00 on 16th Aug and 03:00 on 16th of Aug about the same level. But with TDI and Stochastics, I see an upside divergence while the actual candles are confirming a very slightly upside divergence as well. Thus while the Synergy-pro-TDI is about at the same level in those moments mentioned....Ignored
at least, this thread is not too quiet....
I am no TDI expert so let's wait for the expert to answer your question....
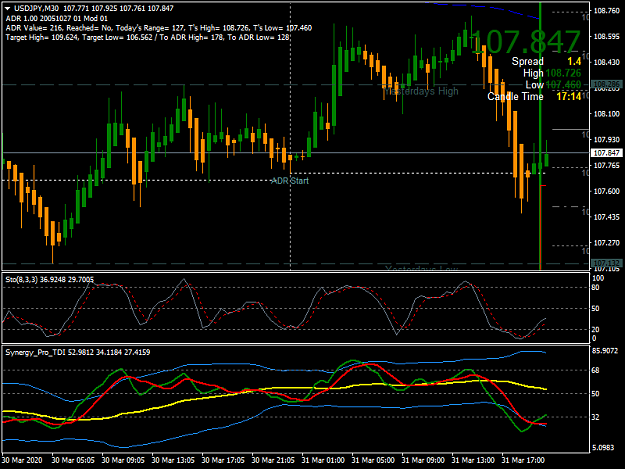
Besides using synergy APB, I also checked candlestick formation. If you see the candlestick, you can have a simple chart pattern, price close above the trendline, tokyo just opened and if we combine with Likica's method: trade away from DOL, EMA 200 and divergence..... it was a valid signal. After TDI signal, I wait for 1 candle for confirmation and open buy position when the confirmation candle closed (when new candle open)
Attached Image (click to enlarge)

1