{quote} good trading TSS {quote} Iddd, Did you download tms 16.zip on post#1 and attached all of them to your mt4? Or check again if your chart 'indicator list' has TMS_Angleator V3-RT2 in it?
Ignored
Yes tms16 downloaded from post 1. No i attached the template. If i attach the TMS_Angleator it just gives me a blue box on top of the section i marked red on my previous screenshot.
Can you please advise how do you evaluate if a given currency is strong or weak? Do you have any procedure for that or you just see it?
The last examples that you shared are really impressive in terms of your ability to assess how far the price can go (for instance Friday's UC, I stopped at BRN, you took it all at ADR. How did you know the BRN will be broken?)
Additional question is - Do you evaluate it basing from what the price bounced off? If yes, can you please tell us what you consider as strong resistance? Would you trade only from DOL or only from Pivot or you'd rather wait for stronger confluence?
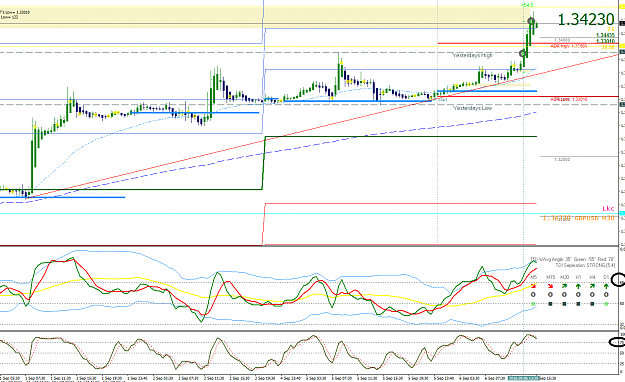
Let my add my last trade this week.
I entered this trade because price bounced from EMA50 (first time) and EMA200, crossing DOL with BEOB and div, a little bit higher was a strong resistance.
Price had one obstacle to cross and it was yesterday low which was also previous S&R level. Finally price didn't cross that level even though it was tested a couple of times and tested once before my entry. Knowing that this level is strong but already tested should I've entered this trade?
Hi Likica, Can you please advise how do you evaluate if a given currency is strong or weak? Do you have any procedure for that or you just see it? The last examples that you shared are really impressive in terms of your ability to assess how far the price can go (for instance Friday's UC, I stopped at BRN, you took it all at ADR. How did you know the BRN will be broken?) Additional question is - Do you evaluate it basing from what the price bounced off? If yes, can you please tell us what you consider as strong resistance? Would you trade only from...
Ignored
Hi J,
Hope my followings (in bold writing) help...
Can you please advise how do you evaluate if a given currency is strong or weak? Do you have any procedure for that or you just see it? I usually check their relatives to see what they were doing, such as CAD if I mentioned this currency was weak because I saw UCAD GCAD going up, and if I normally check crude oil for addtional info, and if I had a buy setting up on ECAD, I would jump in with more confidence
The last examples that you shared are really impressive in terms of your ability to assess how far the price can go (for instance Friday's UC, I stopped at BRN, you took it all at ADR. How did you know the BRN will be broken?) If I have time to monitor my trades, I always keep eyes on PA and TDI and stoc in progress, with UCAD long, TDI and stoc were way overbought (sign of strong bulls) making me moving my PT to ADR max. I think I mentioned this before which is a good tip to stay in...
Additional question is - Do you evaluate it basing from what the price bounced off? If yes, can you please tell us what you consider as strong resistance? Would you trade only from DOL or only from Pivot or you'd rather wait for stronger confluence? It s not about DOL of Pivot, it s more about what PA reacts around them that counts. Do remember to look left...
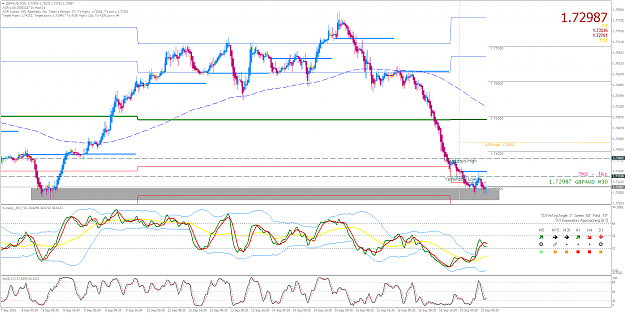
Let my add my last trade this week.
I entered this trade because price bounced from EMA50 (first time) and EMA200, crossing DOL with BEOB and div, a little bit higher was a strong resistance.
Price had one obstacle to cross and it was yesterday low which was also previous S&R level. Finally price didn't cross that level even though it was tested a couple of times and tested once before my entry. Knowing that this level is strong but already tested should I've entered this trade? I would not enter a trade around YL/YH unless it is broken (closed below/above it) and price come back to retouch the level. There is an exception to enter is if stoc and tdi are at overbought (to buy)/oversold (to sell). Most of the time, MMs will push hard so price will go thru YL/YH then fail to close beyoung that and stop you out and get others who wait at the door for a breakout trades then to get stopped out too as price will turn around (this good trick works every time for MMs). You would notice if you read all my posts.
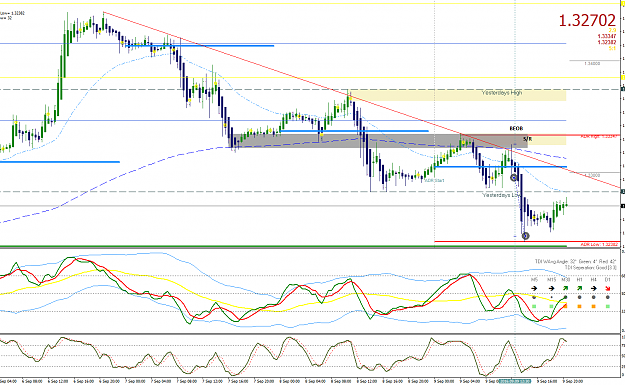
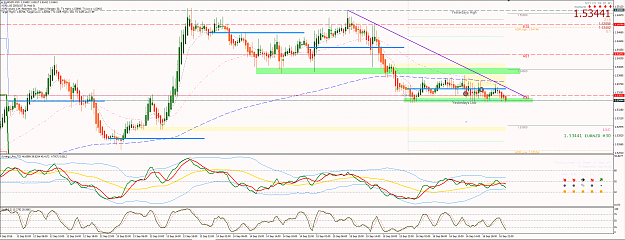
To answer your question, I would not enter this EN trade as the conditions did not meet my criteria I mentioned (tdi and stoc were not at oversold to sell). No need to have further clarification. This rule can not be broken or you will be given a big fine not by me but by MM Here is an example of the exception to enter (GU buy@overbought bounced off support) that I mentioned.
If you looked through all my posts (again) you would bring up this winner and asked why this GU (2nd pic) turned out good while going against YL which was not broken at the time I entered the trade. (I already stated the reason with my post but repeat it here so for you to easily compare your EN with my GU winner to see the differences) I was happy to see price retraced at least 50% of recent move and was rejected by my trend line, 200MA and 'look left' S/R with a bearish outside bar and importantly it created a lower high. So it s up to you to break this rule or to follow with peace
{quote} Hi J, Hope my followings (in bold writing) help... Can you please advise how do you evaluate if a given currency is strong or weak? Do you have any procedure for that or you just see it? I usually check their relatives to see what they were doing, such as CAD if I mentioned this currency was weak because I saw UCAD GCAD going up, and if I normally check crude oil for addtional info, and if I had a buy setting up on ECAD, I would jump in with more confidence The last examples that you shared are really impressive in terms of your ability...
Ignored
Thanks for explaining me this in detail Likica.
I think it's about time to go through your trades once more, to see what have I omitted during the first time.
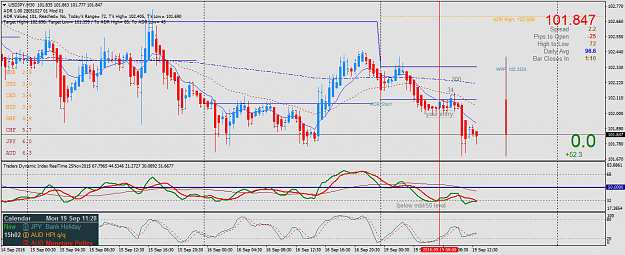
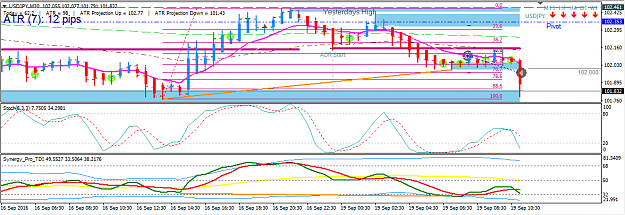
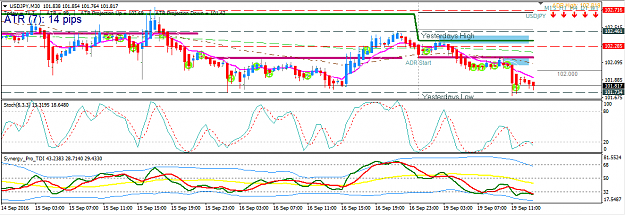
what did I do wrong? the setup had so much going for it. usd/jpy m30 support at BRN hidden divergence for continuation support and wicks@ 61.8 fib inside bar breakout at support yet it fails......... {image}
Ignored
Hi you missed the one of LK post http://www.forexfactory.com/showthre...73#post9139273 please look closer before you enter.
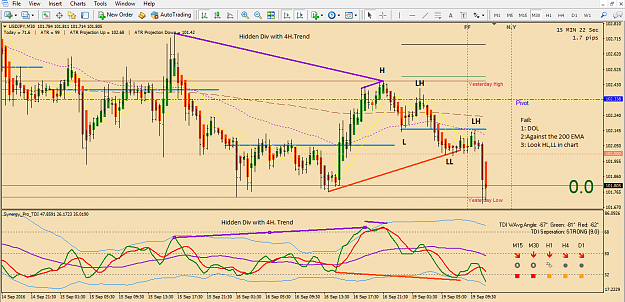
dont trade if previous Hidden Div is already happend and now TDI shoing Div Again. I am not much expert as LK and other but please look my observation in below picture.
{quote} Hi you missed the one of LK post http://www.forexfactory.com/showthre...73#post9139273 please look closer before you enter. dont trade if previous Hidden Div is already happend and now TDI shoing Div Again. I am not much expert as LK and other but please look my observation in below picture. {image} Thank You.
Ignored
hi, thanks for the reply. I did see that LK post but thought that we must not take a hidden divergence if there was a regular divergence coming the other way, i spotted the hidden div coming the other way but thought it would be alright?
i saw the dol too but price had already been through dol already today so as i understand it dol is no longer resistance
{quote} hi, thanks for the reply. I did see that LK post but thought that we must not take a hidden divergence if there was a regular divergence coming the other way, i spotted the hidden div coming the other way but thought it would be alright? i saw the dol too but price had already been through dol already today so as i understand it dol is no longer resistance
Ignored
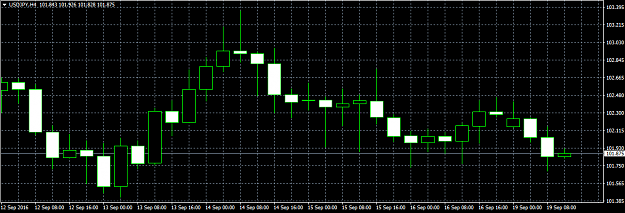
Look at the h4 chart PA when you took that trade. Previous candle closed below the DOL with a bearish engulfing and then when you took the trade there was a perfect retest of the DOL before continuing.
Success means going from failure to failure without loss of enthusiasm
{quote}Look at the h4 chart PA when you took that trade. Previous candle closed below the DOL with a bearish engulfing and then when you took the trade there was a perfect retest of the DOL before continuing.
Ignored
im sorry lisat but i cannot see a bearish engulfing on h4.
here is my naked chart below
about the dol, i can see what you mean on the H4. are you saying we must wait for a h4 close of dol?
I thought m30 was fine?
what did I do wrong? the setup had so much going for it. usd/jpy m30 support at BRN hidden divergence for continuation support and wicks@ 61.8 fib inside bar breakout at support yet it fails......... {image}
Ignored
One trade failed, so what? No matter how strong the signal or how good the strategy is you will never know if your trade will be a winner or loser. The best strategies have losers.
Trading is a game of probabilities and pattern recognition. Especially trading now when we are in the middle of huge news on Wednesday, JPY and USD.
what did I do wrong? the setup had so much going for it. usd/jpy m30 support at BRN hidden divergence for continuation support and wicks@ 61.8 fib inside bar breakout at support yet it fails......... {image}
Ignored
You are not using the indicators you have on your chart properly. You have moving averages and TDi and they are not indicating to go long..you have the 200 ema and also the mbl and the 50 level on the tdi..
what did I do wrong? the setup had so much going for it. usd/jpy m30 support at BRN hidden divergence for continuation support and wicks@ 61.8 fib inside bar breakout at support yet it fails......... {image}
Ignored
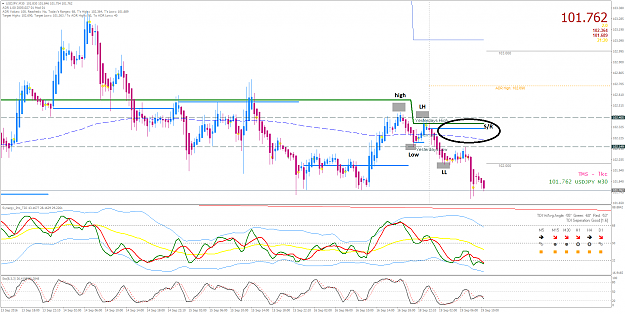
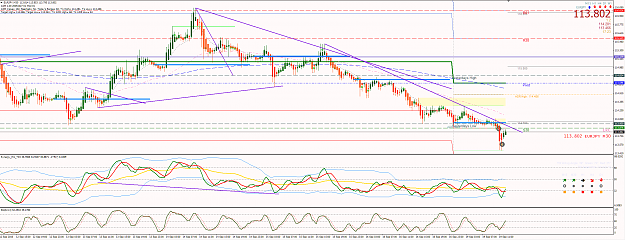
price keeps making LH LL and facing multi layers of resistants (Weekly S/R (green), DOL (blue) 200MA, price did not go thru them after the day started. What were you expecting to buy with such bearish condition instead of thinking selling? Also Shad4 pointed out about bearish hidden divergence which you could have jumped in a short for continuation of the trend on M30 after price made LH and bounced off Wkly SR, DOL and 200MA (if you were avail to trade at that moment).
It 's good to see you guys participating and helping ladies and gens.
{quote} You are not using the indicators you have on your chart properly. You have moving averages and TDi and they are not indicating to go long..you have the 200 ema and also the mbl and the 50 level on the tdi.. {image}
{quote} price keeps making LH LL and facing multi layers of resistants (Weekly S/R (green), DOL (blue) 200MA, price did not go thru them after the day started. What were you expecting to buy with such bearish condition instead of thinking selling? Also Shad4 pointed out about bearish hidden divergence which you could have jumped in a short for continuation of the trend on M30 after price made LH and bounced off Wkly SR, DOL and 200MA (if you were avail to trade at that moment) {image}
Ignored
hi likica, thanks for the feeback.
fair point about the pivot. I didn't really notice it for some reason, but sometimes when it is there i get confused about whether or not i should be buying or selling when it is around as the pivot can bounce both ways, unlike the weekly s32, s64 etc which is only support [so don't sell into it], in this case it did look like it was bouncing downwards though.
{quote} You are not using the indicators you have on your chart properly. You have moving averages and TDi and they are not indicating to go long..you have the 200 ema and also the mbl and the 50 level on the tdi.. {image}
Ignored
Hi, thanks for the feedback also.
I will explain why I went long even though TDI was under the mbl, it was because I had support from the brn, and also the 61.8% fib which is drawn on my chart. so as i had multi support i went early without price being above the mbl. Likica often does this.
however I now know that I shouldn't be going long at that point in the first place, due to the errors which have pointed out.
as for the 34 ema, thanks.
I only added it recently tbh, im still a little green on how to use it ...but im guessing price above means bullish and price below is bearish sentiment
{quote} hi likica, thanks for the feeback. fair point about the pivot. I didn't really notice it for some reason, but sometimes when it is there i get confused about whether or not i should be buying or selling when it is around as the pivot can bounce both ways, unlike the weekly s32, s64 etc which is only support [so don't sell into it], in this case it did look like it was bouncing downwards though. ps: price had gone through my dol [see below] {image}
Ignored
if you only focus on pivots or MA or DOL and divergence and hidden divergence by themself , you will fail, unless you look at higher time frames like H4 D1 to buil positions. Your problem is you fail to read price actions around those levels to see if buyers or sellers were strong at that moment, that why you were confused whether to buy or to sell. Can you see that price were stepping down? both big picture (look at swing to swing) and small picture (as marked on my chart with LH LL)
{quote} Iddd, Did you download tms 16.zip on post#1 and attached all of them to your mt4? Or check again if your chart 'indicator list' has TMS_Angleator V3-RT2 in it?
Ignored