Trade Logic applied to Trend Following continued....
Following on from last night's post I thought I would outline the reason for my current entry on NZDUSD.
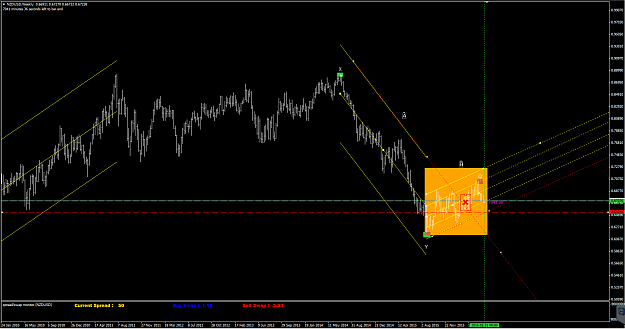
The chart below on W1 highlights my zone of interest in orange. I am looking for a consistent way to describe recent price action on the W1 chart. The only thing jumping out of me as significant is that overall, price action appears to have an upwards directional bias. This is particularly clear when we extend our lookback to observe a greater history of data.
What I am specifically looking for is a way to describe the overall features of price action over time. A single bar means nothing to me, but a collection of bars holds greater information for my technique.
Let's assume my lookback was to Jan 2014. Is there a way to grossly describe (most simply describe) price behaviour over this period without being pedantic about the specific detail. The way I would describe overall price behaviour across this lookback is as follows:
1. A bear phase commencing from a swing high (X) on 6/7/2014 which extends to a swing low (Y) on 23/8/2015. From the swing low we had a volatile end to the trend with a bit of undecisiveness about whether the bear phase would end or not. This resulted in me extending the width of the SDC over this phase to encapsulate this data as there was some suggestion that we may have some false trend breaks that would quickly arise in mean reversion back into the long term bear phase. Quite clearly at X marked on the chart we were getting more confident that the bear phase had ended as price continued to make higher highs. This was the point I officially declared that according to my trend definition, the bear phase was over. Of course this therefore made me start to think about bull phase opportunities but I needed further confirmation with more recent price data to confirm these views.
2. When price reached a high at point Q there was sufficient price data to draw an SDC from the prior swing low to define the overall volatility range within this general bull phase. The resultant SDC drawn ensured that all price action since the swing low was contained within the channel and the overall direction and width was used to define two important pieces of information (volatility which is an expression of momentum, and the overall directional bias to price determined by a linear regression line of best fit) to 'project' my view of what I would like to see unfold in my definition of a trend. So I then extend the information into the future from what is currently known according to my definition.
3. Furthermore I then place further channels to define overbought and oversold zones within this overall price movement. I now have a context that allows me to trade breakouts or retracement entries in my trend definition.
Now from the high at Q (which is where I last extended my SDC to) price has retraced from this high back towards the oversold zone of my trend definition. I am therefore looking for an entry where price confirms that it is now possibly reverting back towards the linear regression line of best fit.
So I now drill down into the daily chart (D1) to place my entry within this broader context scaled to W1.
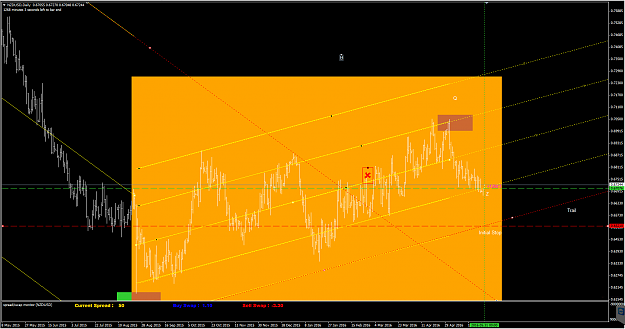
I wait until we have an open on D1 within the oversold zone and then need price to retrace back to the mean and cross the level 2 SDC line which it did at point Z. That is my entry point. My initial stop is defined by the outermost point of the SDC at the time of entry. The outermost SDC line then defines the trail within which future price action needs to be contained within for my definition of trend to remain intact.
Some things that the SDC takes care of itself are as follows:
Following on from last night's post I thought I would outline the reason for my current entry on NZDUSD.
The chart below on W1 highlights my zone of interest in orange. I am looking for a consistent way to describe recent price action on the W1 chart. The only thing jumping out of me as significant is that overall, price action appears to have an upwards directional bias. This is particularly clear when we extend our lookback to observe a greater history of data.
Attached Image (click to enlarge)
What I am specifically looking for is a way to describe the overall features of price action over time. A single bar means nothing to me, but a collection of bars holds greater information for my technique.
Let's assume my lookback was to Jan 2014. Is there a way to grossly describe (most simply describe) price behaviour over this period without being pedantic about the specific detail. The way I would describe overall price behaviour across this lookback is as follows:
1. A bear phase commencing from a swing high (X) on 6/7/2014 which extends to a swing low (Y) on 23/8/2015. From the swing low we had a volatile end to the trend with a bit of undecisiveness about whether the bear phase would end or not. This resulted in me extending the width of the SDC over this phase to encapsulate this data as there was some suggestion that we may have some false trend breaks that would quickly arise in mean reversion back into the long term bear phase. Quite clearly at X marked on the chart we were getting more confident that the bear phase had ended as price continued to make higher highs. This was the point I officially declared that according to my trend definition, the bear phase was over. Of course this therefore made me start to think about bull phase opportunities but I needed further confirmation with more recent price data to confirm these views.
2. When price reached a high at point Q there was sufficient price data to draw an SDC from the prior swing low to define the overall volatility range within this general bull phase. The resultant SDC drawn ensured that all price action since the swing low was contained within the channel and the overall direction and width was used to define two important pieces of information (volatility which is an expression of momentum, and the overall directional bias to price determined by a linear regression line of best fit) to 'project' my view of what I would like to see unfold in my definition of a trend. So I then extend the information into the future from what is currently known according to my definition.
3. Furthermore I then place further channels to define overbought and oversold zones within this overall price movement. I now have a context that allows me to trade breakouts or retracement entries in my trend definition.
Now from the high at Q (which is where I last extended my SDC to) price has retraced from this high back towards the oversold zone of my trend definition. I am therefore looking for an entry where price confirms that it is now possibly reverting back towards the linear regression line of best fit.
So I now drill down into the daily chart (D1) to place my entry within this broader context scaled to W1.
Attached Image (click to enlarge)
I wait until we have an open on D1 within the oversold zone and then need price to retrace back to the mean and cross the level 2 SDC line which it did at point Z. That is my entry point. My initial stop is defined by the outermost point of the SDC at the time of entry. The outermost SDC line then defines the trail within which future price action needs to be contained within for my definition of trend to remain intact.
Some things that the SDC takes care of itself are as follows:
- It expands and contracts with current volatility and acts in the same way as an ATR measure of volatility. Highly volatile trends therefore have wide SDC's and as a result, position sizes are decreased as the point from entry to the outer SDC is wider than normal.
- The SDC is continuously redrawn as new highs/lows are made and the width extended to include most recent price action. This dynamic adjustment of the SDC ensures that you let trends breathe in accordance with their volatility and momentum profile.
- The trailing stop is always sloping in your favour for a quick exit if the trend definition breaks down. Immediately from the point of entry onwards, this technique ensures you remain in the zone of your trend definition.;
- This projective technique stamps rigid rules that needs to be obeyed for your trend to remain intact. If the market doesn't meet those rules, then you are out. If they do, then you can ride your projection for as long as the rules remain in tact.
Regards
C