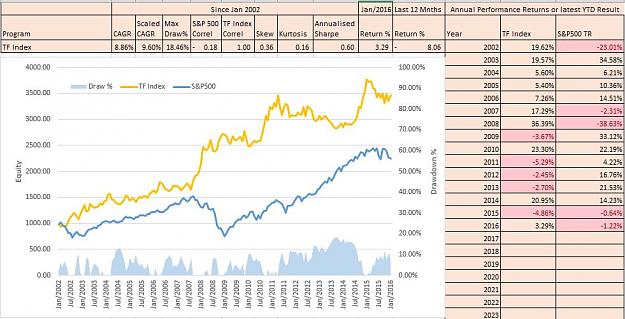
December Performance Results - 1 Jan 2002 to 31 Dec 2015
To improve direct comparisons between the automated systems described in prior posts with the FM performance for the same period, I have amended the performance assessment period (previously 1 Jan 2000 to 31 Dec 2015) to 1 Jan 2002 - 31 Dec 2015 to remove start up lag effects.
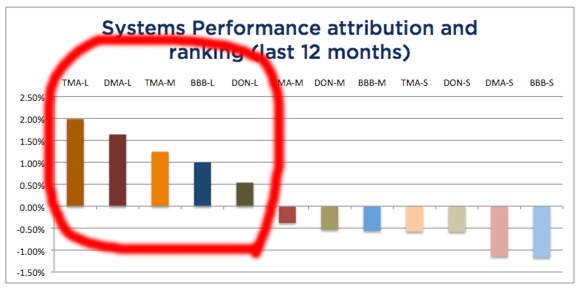
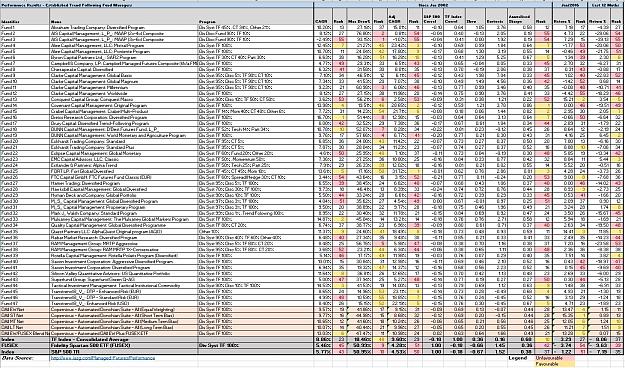
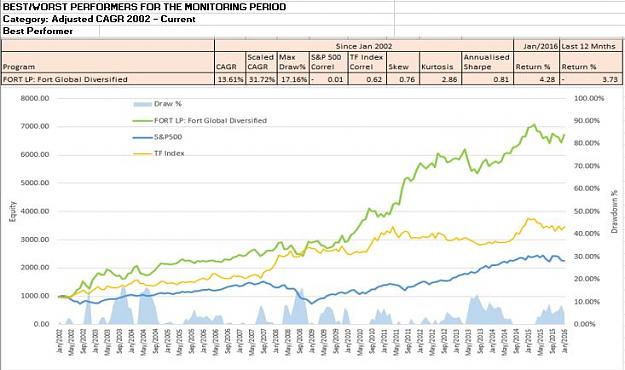
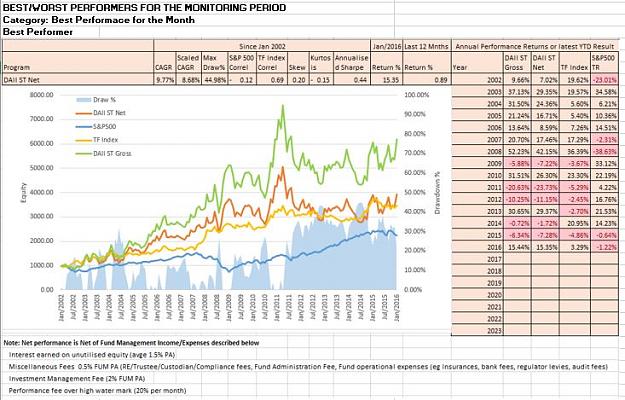
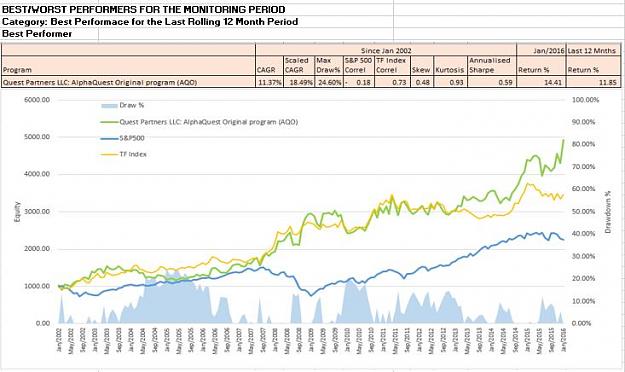
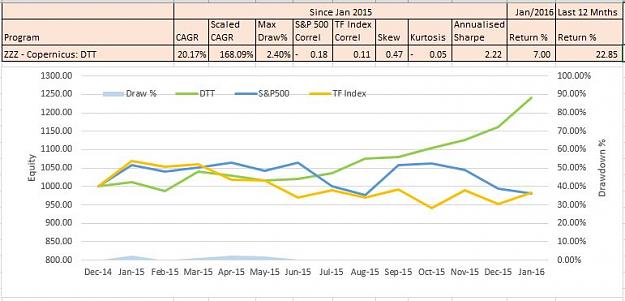
Below is a comprehensive listing of 57 discreet systems described by 47 Trend Following FM's, the FUSEX ETF, The TF Index, the S&P 500 TR Index plus 5 Blended Automated Donchian Systems. Each of these systems is ranked in accordance with varying performance measures.
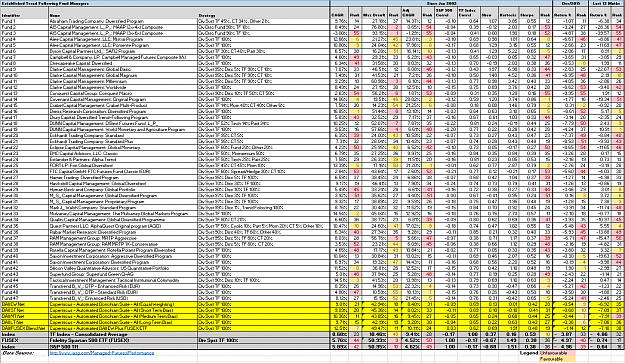
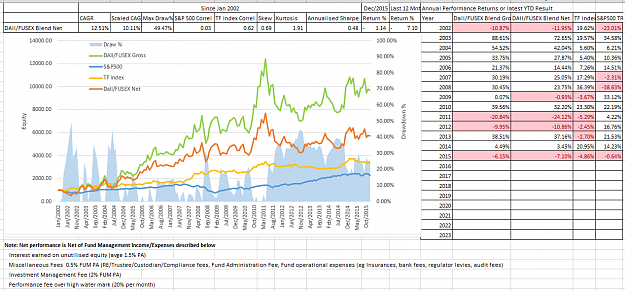
So how do the Donchian blends fair against the competition? The systems rank highly in the top 20 in terms of CAGR with the best performer being DAll/FUSEX which is a blend of the Donchian automated systems (with equal weighting) and the Fidelity Spartan ETF which mimics the performance of the S&P500 TR Index. The reason for the success of this system is attributed to the very low correlation between the S&P500 TR Index and the TF Index. As a result it was sensible to blend these systems to flatten the equity curve and allow enhanced scaled benefits.
In terms of adjusted CAGR which takes into account CAGR scaled to equivalent drawdowns, DAll/FUSEX was also the top performer of the Donchian systems and ranked in 24th out of 57 which suggests that there is still a way to go in optimising the equity curve of these simple blended portfolio's. In general the CTA's have very robust risk management metrics and a range of systems that allow significant enhanced risk management improvements.
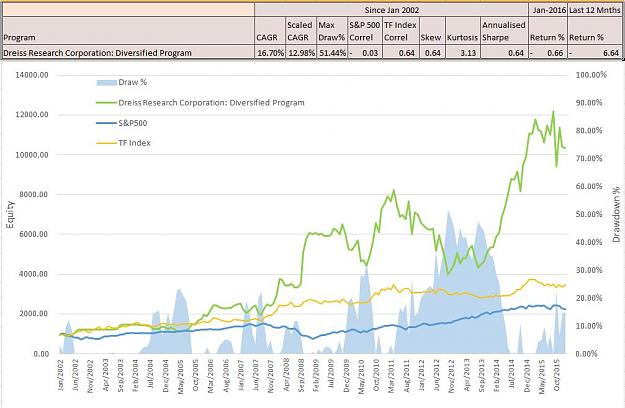
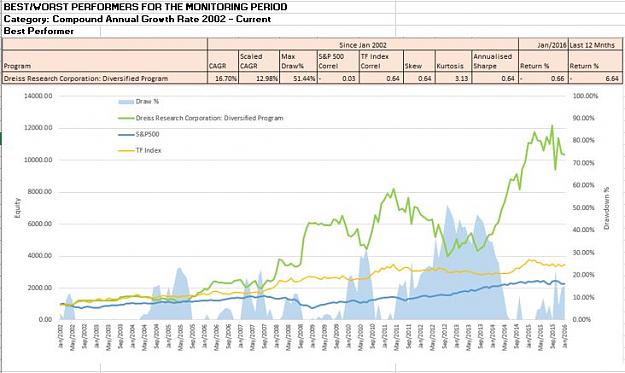
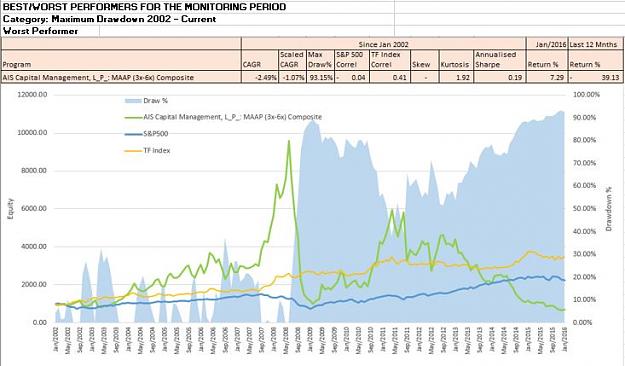
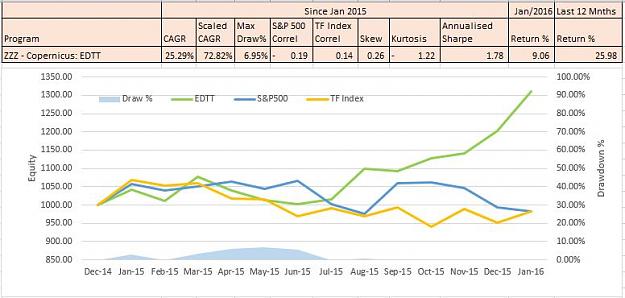
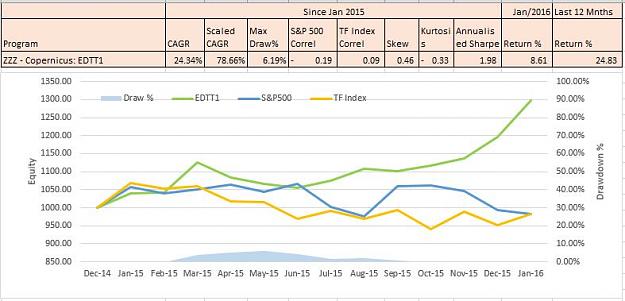
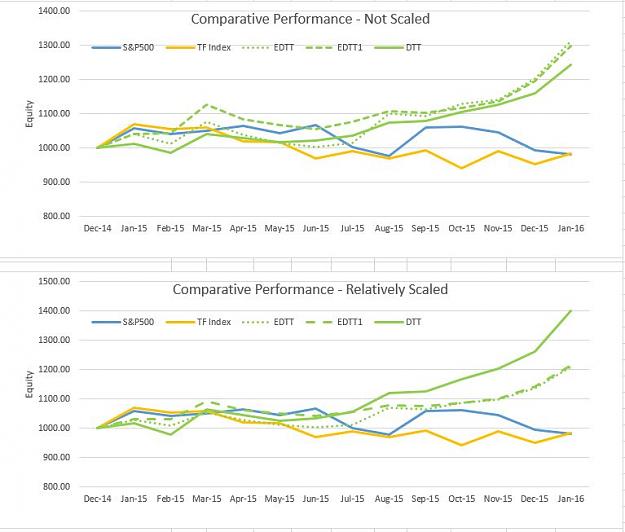
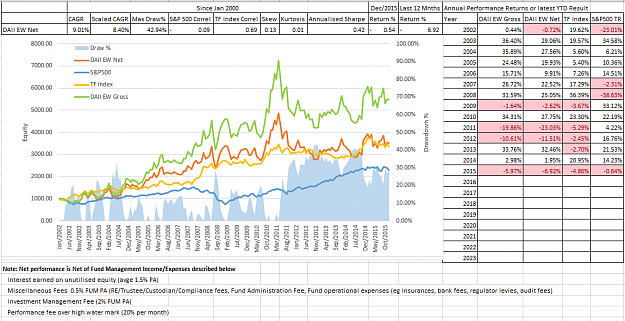
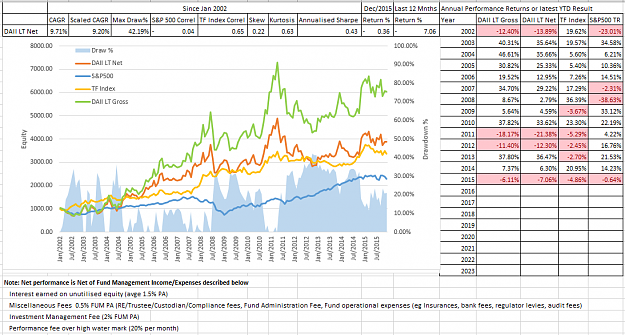
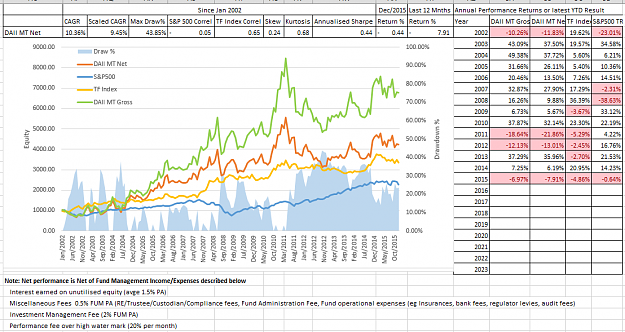
Below are performance charts of each hypothetical automated system included in this performance assessment.

Will be clocking off for a while now.
Have a great remaining trade week all. :-)
C
To improve direct comparisons between the automated systems described in prior posts with the FM performance for the same period, I have amended the performance assessment period (previously 1 Jan 2000 to 31 Dec 2015) to 1 Jan 2002 - 31 Dec 2015 to remove start up lag effects.
Below is a comprehensive listing of 57 discreet systems described by 47 Trend Following FM's, the FUSEX ETF, The TF Index, the S&P 500 TR Index plus 5 Blended Automated Donchian Systems. Each of these systems is ranked in accordance with varying performance measures.
Attached Image (click to enlarge)
So how do the Donchian blends fair against the competition? The systems rank highly in the top 20 in terms of CAGR with the best performer being DAll/FUSEX which is a blend of the Donchian automated systems (with equal weighting) and the Fidelity Spartan ETF which mimics the performance of the S&P500 TR Index. The reason for the success of this system is attributed to the very low correlation between the S&P500 TR Index and the TF Index. As a result it was sensible to blend these systems to flatten the equity curve and allow enhanced scaled benefits.
In terms of adjusted CAGR which takes into account CAGR scaled to equivalent drawdowns, DAll/FUSEX was also the top performer of the Donchian systems and ranked in 24th out of 57 which suggests that there is still a way to go in optimising the equity curve of these simple blended portfolio's. In general the CTA's have very robust risk management metrics and a range of systems that allow significant enhanced risk management improvements.
Below are performance charts of each hypothetical automated system included in this performance assessment.
Attached Image (click to enlarge)
Attached Image (click to enlarge)
Attached Image (click to enlarge)
Attached Image (click to enlarge)
Attached Image (click to enlarge)
Will be clocking off for a while now.
Have a great remaining trade week all. :-)
C