would have worked really nice!
i think the EA is to noisy yet. i agree with fx-jays. those improvments would be awesome!
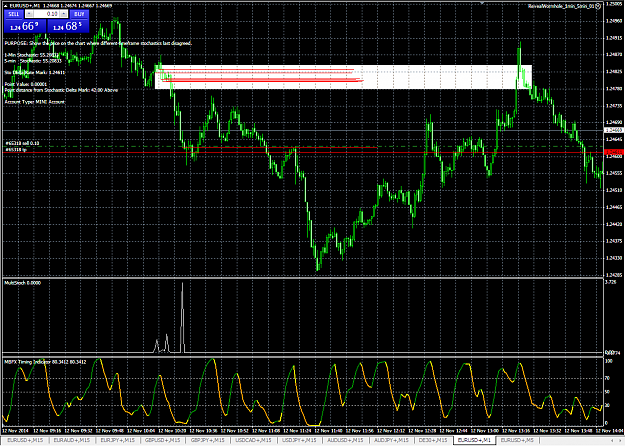
Real Ticks Discarded, Price Mismatch, Minutes Bars Absent 0 replies
Data window information and Journal data mismatch 5 replies
Pepperstone Historical Data Mismatch 1 reply
Stochastic divergence indicator with stochastic cross? 0 replies
Daily Stochastic Oscillator System 171 replies
Disliked{quote} Great idea Fx-Jay. I'm no coder either. I can chop around in the code enough to change colors, display parameters, and the like, but nothing serious. I wonder if placing colored vertical lines at the events you're describing would be easier to code. Would that suffice for your idea?Ignored
Disliked{quote} I would somehow like to see a dissimilarity area rather than a dissimilarity line. The current EA redraws a line everytime a new dissimilarity shows up. What I have noticed is that the dissimilarity ranges between few seconds to few minutes in lower TFs. During these minutes/seconds price moves within a range. More often then not this range that has been made during the dissimilarity period is revisited once similarity is restored. Unless you are really focusing on your screen at the time the first dissimilarity occurs, you are most likely...Ignored
DislikedHey Fx Jay i have noticed that as well. It would be helpful and i agree with you . Metat Coder what do you think? can it be done?Ignored
Disliked{quote} Paste this code under the code that draws the line and it will draw red dots where the event occurs string t=TimeToStr(TimeLocal()); ObjectCreate("CandleDot"+t,OBJ_TEXT,0,TimeCurrent(), valStoDeltaRateMark); ObjectSetText("CandleDot"+t,CharToStr(159),18,"Wingdings",Red);Ignored
Disliked{quote} Hey i am not a coder so i dont even know where to start. is it possible to make the change and post the upgraded EA.Ignored
Disliked{quote} I´m not a coder either, but i think this will work. {file} {file} {file} {file}Ignored
Disliked{quote} I would somehow like to see a dissimilarity area rather than a dissimilarity line. The current EA redraws a line everytime a new dissimilarity shows up. What I have noticed is that the dissimilarity ranges between few seconds to few minutes in lower TFs. During these minutes/seconds price moves within a range. More often then not this range that has been made during the dissimilarity period is revisited once similarity is restored. Unless you are really focusing on your screen at the time the first dissimilarity occurs, you are most likely...Ignored
DislikedI haven't read all yet, so I do not know how to calculate the ideal K-parameters. But regardless the system, the K-param is one of the mql4-stochastic parameters (stoch-K, stoch-D, stoch-Slowing, etc.); to learn more about the stochastic pls. have a look eg. to http://ta.mql4.com/indicators/oscillators/stochasticIgnored
DislikedThis draws red dots as long as the devation lasts. Looks a bit bloody sometimes. {file}Ignored
DislikedI do wish I had the time to explore the suggested enhancements as I'm sure they have merit. Thanks to all who are taking a look, thinking, and providing suggestions. Also I like seeing others take up new coding. Very cool.Ignored
Disliked{quote} Hey Ultimate6 What you can look at is when a red dot appears because of the dissimilarity appears, when the market comes back and test the red dot you should remove it. remember the market comes back to test those zones. i think the only dots that should be seen are the dots or ( dissimilarity) where the market did not come back and test . Tell me what you guys think. If that makes sense.Ignored