|
Membership Revoked
|
Joined May 2012
|1,218 Posts
Hi All,
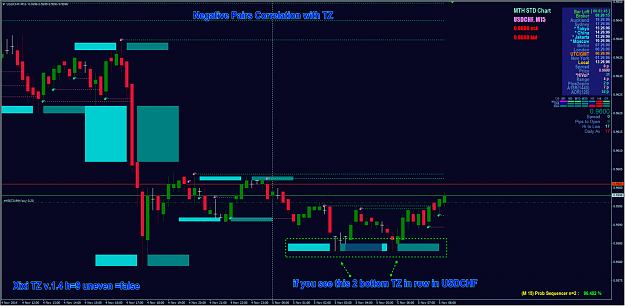
for example
if you see this in USDCHF M15
Attached Image (click to enlarge)
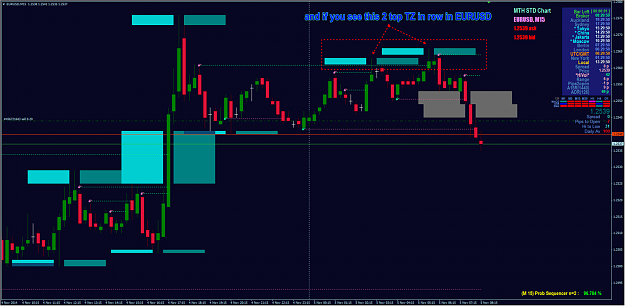
and also you see this in EURUSD M15
Attached Image (click to enlarge)
I think you should know what to do next... and if that happen in higher TF, also if that happen with 'mid zone' formation.. then i will say.. have a nice party..
{quote} Hi I think it is Fibonacci line,and you say its not,OK I will try Photoscape. thx very much my friend.
Ignored
Lol.. I'm sorry I misunderstood you. I thought it was that arrow lines.. , and yes that Fibo Ret tools.. rewriting the data as range level percentage..
{quote} Lol.. I'm sorry I misunderstood you. I thought it was that arrow lines.. , and yes that Fibo Ret tools.. rewriting the data as range level percentage.. best regards. MTH
Ignored
Hi
if you can share it?
its different with the Fibo on the MT4?
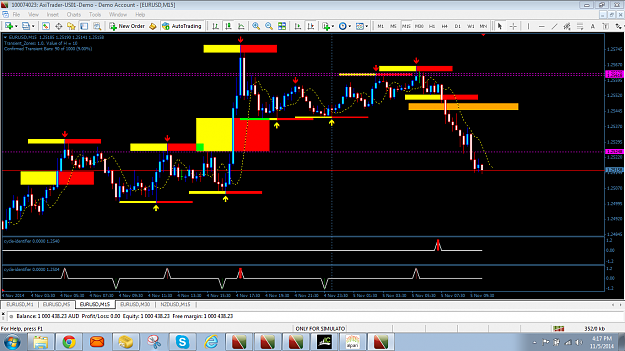
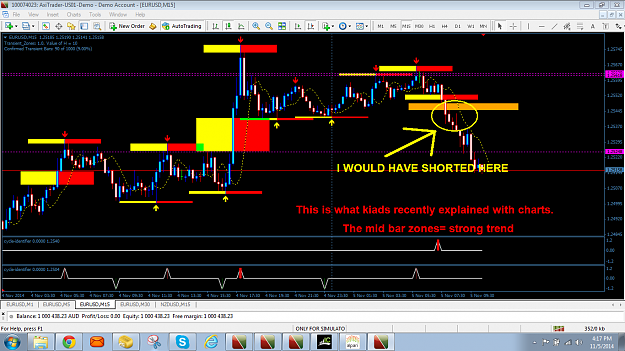
Hi all, as a kind of noob, allow me to post this here, rather than in big league thread there... {image} and for the strongest signal from TZ indicator the 'mid' zone. you can expect continuation price movement between 50% to 300% of left 'wing' range. {image} hope it help and best regards and sorry if this is only 'elementary' matter for some of you.. MTH
Ignored
Kudos kiads for that posts.
It has been said several times that there are many ways to trade this transient zones. Anybody that is yet to have an edge on this transient zones trading stuff, should just follow the basic principle of these chart especially the first chart that deals with mid bar in a trending market, you will never regret, then combine it with fx-jay's analysis in a ranging market, then you will have more than enough. They happen of everyday, and can happen on anytime frame. The higher the time frame, the more the returns. can it be simpler than this?
We Win Some, We Loose Some, But Let your Win Rates be More to be Successful
{quote} Hi Carbonado, Cheers for the kind words. From what I can tell there is no new version of the transient zone. The disappearing act is known behaviour and the screen does have to be refreshed, particularly for higher timeframes or when price action clears a forming zone. It will be up to FreeFox to supply a new version if he has time to do so. Alternatively, there are indicators from Kprsa and Sciurus that offer the same thing but visually different. I've attached Sciurus's indicator here and K's indicator is already in the attachments page...
Ignored
Thanks so much vlady and northtrader only that i use mt4
"[quote=vlady1974;7846656]{quote} Excellent work! This is exactly the kind of trades and "added" utilisation that I use as well as some other folk. Notice that the breakout also coincided with the breakout of an extended line from a previous TZ from the left. I like the use of Fibs intelligently on the confirmed side of the TZ. Weekly pivots can also be used for directional bias. I also agree with the use of non-existent "top" TZ as an indicator of continuation.[/"
Hey vlady,i see i have to go read the sim thread so as to have a better understanding.wld be starting from page 286.unfortunately i dont have much time till next week.........another thing is the thread keeps growing so fast...soi need to move fast.thanks for this thread once again............
{quote} Excellent work! This is exactly the kind of trades and "added" utilisation that I use as well as some other folk. Notice that the breakout also coincided with the breakout of an extended line from a previous TZ from the left. I like the use of Fibs intelligently on the confirmed side of the TZ. Weekly pivots can also be used for directional bias. I also agree with the use of non-existent "top" TZ as an indicator of continuation.[/" Hey vlady,i see i have to go read the sim thread so as to have a better understanding.wld
Ignored
...
Ignored
sorry a question am sure it would be on sim thread....is transient zone used in any market..stocks,commodities,and any pair in currency as i saw eurusdd sayiny he adapted it for just eurusd and maybe audusd.....thanks again
{quote}{quote} sorry a question am sure it would be on sim thread....is transient zone used in any market..stocks,commodities,and any pair in currency as i saw eurusdd sayiny he adapted it for just eurusd and maybe audusd.....thanks again
Ignored
This is a fair enough question.
The short answer is YES for currencies.
The medium answer is that Eurusdd did use examples from EURUSD because it was the most balanced market in terms of supply and demand strength being equal. Hence, when calculating probabilities, it has more reliability.
The longer answer is that YES, it does work on other pairs. Eurusdd has used USDCHF before. I've traded it on other pairs, including gold and crude oil. I've seen others do cross currency trades which is excellent. I've not seen anyone apply it to stocks or commodities.... but again, if you removed the ticker symbol and the timeframe... the candles behave the same way. There will probably be more gaps in prices for stocks and commodities, but the principles still hold - what you don't know unless you actually do the quant - is know the global probability of return. Soyabeans for example may have a different rate to 97%... i don't know. But if you knew the principle, then you can test.
A pip is only worth it if you know how much you risked to earn it
thanks gentlemen did short earlier grr silly me but did take profit but did gamble so now i understand and clarified the understanding how to trade that magic system
thanks again gentlemen for your valuable time
keep up the good work
Hello everyone,
maybe I'm starting to understand the concept, but gently, I need to know from you if it is correct or not ...
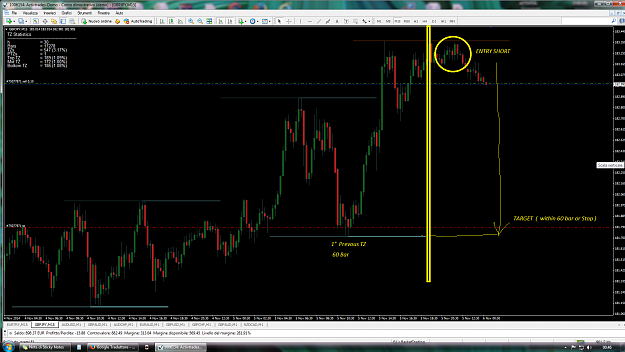
This graphic was confirmed TZ (60 bar), this means that in this area there are prices that have been touched too few times (rare).
If it 's correct, then I suppose that in the next 60 bars there is at least a price that touches the previous TZ area (Target just above tz).
Attached Image (click to enlarge)
Example of probability ':
Probaibility ': 50% of women, 50% of men
IF: If the first H (100) I counted only one women (rare event)
So I bet that in the next H there will be 'at least one woman
In Forex the rare event is the TZ, so it in the next H i bet that the price arrivals area TZ.
This probability are only used for an example
Is this the concept ? Any advice is a huge help to me.
Ps : EurUsdd thanks and thanks for this 3D Vlady, thanks to all
Hello everyone, maybe I'm starting to understand the concept, but gently, I need to know from you if it is correct or not ... This graphic was confirmed TZ (60 bar), this means that in this area there are prices that have been touched too few times (rare). If it 's correct, then I suppose that in the next 60 bars there is at least a price that touches the previous TZ area (Target just above tz). {image} Example of probability ': Probaibility ': 50% of women, 50% of men IF: If the first H (100) I counted only one women (rare event) So I bet that...
vlady, could you with your very teacher words explain the extraterrestial eurusdd concept to me, symple human about the theorem and as the SS indicator is represented in a chart? thks