Joined Apr 2010
|
Status: happy as a pig in shit.
|1,448 Posts
Ok i think my start of the week madness is over for now.
a number of small positions entered.
the thing about trading is you often think thing and then fail to act, often because of fear or greed. a journal allows you to put your instant thoughts down, then allows you to reflect on them later and why you had them in the first place..
not a lot of data to come out. but i feel the need to take some profits in the next few hours. December is a strange month, lots of big profits taken by banks with accounts to settle. volume is often low due to the holiday season and this can lead to unsuitability. I'll be trading as normal but with lower lots on some pairs for the remainder of the month
Ignored
I have little doubt the markets will continue to trend, however 'a bird in the hand is worth 2 in the bush' and a profit ain't a profit till it's taken, so i took some
{quote} Thank you Kraven.... really nothing special... I just didn't copy your levels, in order to try to find my levels The main concept, I think, it's "trade with the trend"... that is the basic! Here is an example of a trade I took on USDCAD, I started with 0.10 Lots, I took off 0.05 at some point, and another 0.03 at another point, 0.02 Lots are still at market and protected... I will leave it there... who knows...it can become a long term leg... I used 4H timeframe and mapped chart using Proce Pivot (J16 concept)... and then tried to follow...
Ignored
Chris I had to look up Proce Pivots as I had never heard of them. I though they were similar to camarilla lines or pivot points.
I do look for 'exhaustion' candles when trading. especially around fakey lines.
{quote} Chris I had to look up Proce Pivots as I had never heard of them. I though they were similar to camarilla lines or pivot points. I do look for 'exhaustion' candles when trading. especially around fakey lines.
Ignored
Hi Kraven...
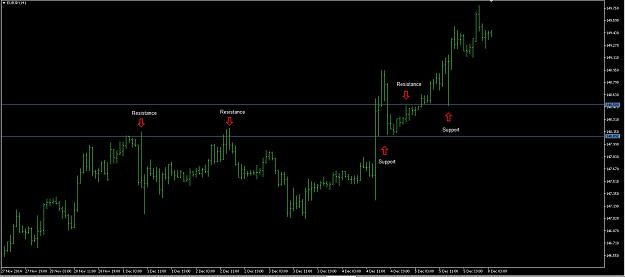
I just made a mistake by writing...it's not "proce pivot" but "price pivot", they are simply support/resistance lines tested more times by price, drawn manually...
For example...a resistance get broken by price... then price retests it and the resistance becomes support... this is a price pivot...
James16 in his thread calls them PPZ (Price Pivot Zone)
Attached Image (click to enlarge)
Market is like a puzzle, YOU have to fit the pieces!!
{quote} Hi Kraven... I just made a mistake by writing...it's not "proce pivot" but "price pivot", they are simply support/resistance lines tested more times by price, drawn manually... For example...a resistance get broken by price... then price retests it and the resistance becomes support... this is a price pivot... James16 in his thread calls them PPZ (Price Pivot Zone) {image}
Ignored
I see Chris. the old support becomes resistance. The old one's are often the best.
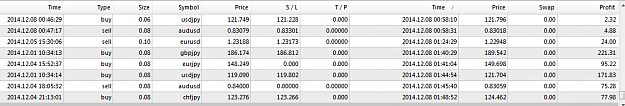
I've been in and out today. just had enough time to enter a few trades but first the one's that closed. And i have to say I'm so glad i took those profits on Sunday..
trades on EJ, EU, Chf/J, GU, AJ all hits stops, most for BE or small profit or loss. NU also hit TP although i can't remember putting it so close to the entry?
missed a fakey on EJ at 148.21
and a breaky on UC (although i still have one from .1437 running)
missed a nice EA breaky too at 4858 or 4874
........................................All of these would have been good
AJ broke 100RN. this really shows the Aussie weakness.
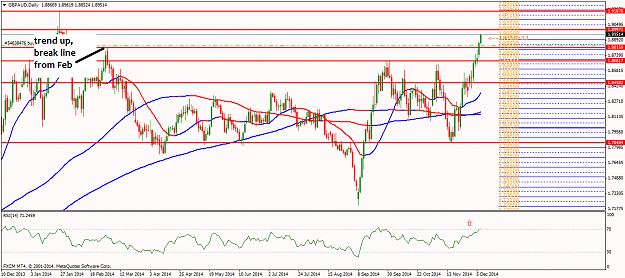
i got an breaky entry on GA at 8835, it's now up +140 and a RN/break line approaching so took profit and left a small amount running
Joined Apr 2010
|
Status: happy as a pig in shit.
|1,448 Posts
We’re seeing a lot of positions profit-taking in the Yen. many believe the yen has collapsed to quick. We’re probably seeing some short-term retracement ahead of the elections. giving better entry opportunities. IMHO.
Joined Apr 2010
|
Status: happy as a pig in shit.
|1,448 Posts
been having so many freezing issues with the MT4 platforms today it's really slowed me down posting here..
'shakeout' looks like it could be over, lot of stops would have been hit, now path cleared for more of a rally.
GA bounced right off the RN and breaky line to the pip as mentioned in post #228. possible fakey at 8718
GU at fakeout line now
EU bounced off 20ma and is heading back to fakey (lets see what it does bypasssbo)
UJ 'shakeout' looks like it could be over, small buy when it hit 20ma and went back through fakey line 118.18(close to bottom) will add again above 119.68
GJ entries at 20ma and break above fakey at 85.46, again above fakey line 86.38, next one above 87.44 fakey.
EJ buy at 20ma above 147.10 fakey line, next entry above 148. 21
ChfJ buy off........you guest it 20ma and fakey line in at 22.35, next buy above 23.21
just got into a EG fakey off 20ma and 7920 using 1hr
miss fakey Gchf and bounce off 20ma and RN
...most of these were pre-meditated pending orders using fakey lines near 20ma, with RN support underneath. phew time for a coffee.
Joined Apr 2010
|
Status: happy as a pig in shit.
|1,448 Posts
experience has told me to expect the unexpected in december.
traditionaly Aussie, Euro, Chf tend to be the strongest currency in december (which goes against what we've seen recently) but there is still time. this would mean going against the trend for most pairs...except Jpy
But be ready for January. Euro, Gbp, Chf all tend to be weak. this is were I will increase my bet size, shorting these against US$, with the trend.
Joined Apr 2010
|
Status: happy as a pig in shit.
|1,448 Posts
well it looks like the big drop was just a shake up to give more opportunities to get into the prevailing trend. I can see many pairs going back to there recent highs and then some consolidating till the new year.
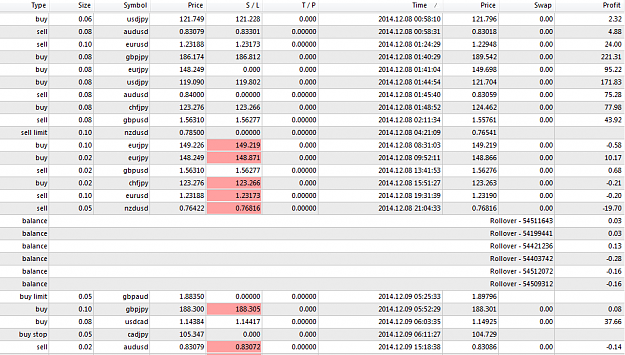
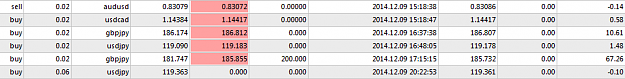
a lot of the entries in post #232 are doing great, and as the price moves with the trend more pending orders are being triggered. I have a few small losses from before the drop but these are small because of the profit taking on Sunday and the new entries are blowing these away. Although i'm happy with my decisions on the recent entries on the drops, it the profit taking and SL while the drop happened I'm most pleased with. Drops like that can wipe trend traders out who are not prepared but i fared pretty well. below are from this week
Joined Apr 2010
|
Status: happy as a pig in shit.
|1,448 Posts
quiet day, so got in some reading. Came across this snippet, that agrees with my sentiment....
Due to the success of the long dollar strategy, many continue to buy USDs on dips. Some longs will have been pared, but the event risk indicates that the market remains very long dollars and is happy to add. This week’s fallout will have some wade to the sidelines and wait for the New Year — that could lead to fast-declining liquidity. Follow U.S. Treasury yields to gauge market risk aversion. Since last Friday’s surprisingly strong nonfarm payrolls headline and details, U.S. 10-year yields have declined -14bp. No matter what, fast, furious, and volatile should be capable of covering market expectations for the remaining few weeks.
More.......
The Kiwis’ Reserve Bank of New Zealand (RBNZ) will take center stage later this afternoon. As the market heads into the rate announcement, the fixed-income market is forecasting a +67% chance of a hold on rates by Governor Graeme Wheeler, up from +62% before the last decision. A more neutral RBNZ statement would likely put further pressure on the Kiwi dollar (NZD$0.7704), with market expectations previously anticipating renewed tightening in the first half of 2015. Already today, the world’s most powerful dairy co-op, New Zealand’s Fonterra (owned by +13k farmers), has cut its full-year 2014/15 payout forecast for farm-gate milk prices, citing geopolitical uncertainty, and subdued demand from China amid elevated inventory levels.
with this in mind i'm going to put a sell order under 7700 and 7659
Joined Apr 2010
|
Status: happy as a pig in shit.
|1,448 Posts
not at my trading desk at the moment but i can see i probably have a sell order triggered in NU, to balance out any spiking i also placed a buy order not to far above above
I also placed a sell on AN breaky, which looks like it hit my partial TP of +100
Joined Apr 2010
|
Status: happy as a pig in shit.
|1,448 Posts
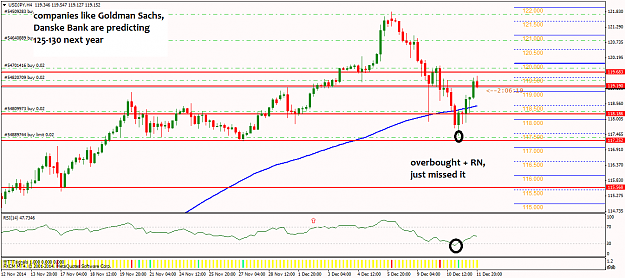
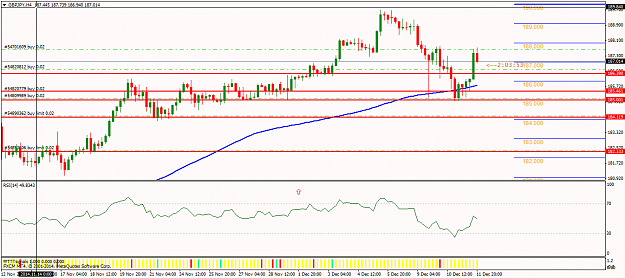
Hopefully if anyone has been reading this thread recently they have took advantage in the momentary strength of the yen, especially against US$ and GBP. Anyone interested in an equity millipede for next year could start now with small increments. I'm avoiding EJ and CJ right now (euro has lots of problems, Cad may suffer from oil pricing)
Attached Image (click to enlarge)
Attached Image (click to enlarge)
got in a fakey earlier GU sell 5686
sold EU just under 2400....lot of resistance at 2360
.......traditionally Euro and Gbp are week in January so will hold maybe add.
Got in on breakys on UC, AU, GA (should have waited to see if 1.9000 supports price) fakey on EG (got in 7910 under MA's)
I'm going to start avoiding GChf, EG because of consolidation although i feel NU provides selling opportunities, back to 7700 soon?
I bought some E/Chf....it's approaching the 1.200 the swiss said they would protect at all costs
What can I say guy's, i'm rich lol. bought USD/RUB at 56.75 and USD/NOK at 7.32
still in sell GU 5675
AU trades up +175 and +54
UC trade up +170....just bounced off new breaky line at 1669
I have a number of........
NU sells
GJ buys
UJ buys
ChfJ buys
some winning, more losing. However I'm confident in the direction of these and will be happy to add.