Joined Feb 2011
|
Status: Crystal Jade Per Day Trader
|397 Posts
Excellent thread. I do have my take on what is here thou. This is what I see regarding this specific pattern.
Here is a custom EURJPY chart, created using dynamic self updating range bars (meaning, these bars do not use a fixed range, but adjusts according to market volatility).
A customized zigzag indicator is added onto the chart to show that the market moves in 3 states; Trending, Squeezing, Expanding. These 'Rectangles' to me look like the 'Trend Resume' part of the market. But mind you, statistically speaking, the swings are pretty reliable in terms of length. This is true when you start comparing 1st vs 3rd swing. You can either trade the 3rd or 4th swing swing as you almost know how far the 3rd swing can go.
So whatever iDoubleStoch is doing, if anyone doubts it, please do your own homework. What he says here is often backed up with real research and hard work. Truth. I'm bookmarking this thread myself =)
Thank you very much iDoubleStoch for your yearly appearance and all the information you shared with unknown novices on the Internet, despite the constant negative attitude of the "pros who know it all" .
I have read quite a lot of the contents you provided and I must confess that all these numbers and definitions did not always 'click' in my mind, but at least it always made me think and try to see a bit 'further', even if for now, I still feel a bit stuck, like going in circles, regarding the developping of a reliable strategy.
But this time, this pattern that can be easily transcripted visually on chart, is perhaps more appealing to me ( certainly because it is simpler ), but maybe also because, as a coincidence I was reading lately about sacred geometry in our universe and this small rectangle may have some sense.
So, about this pattern made of the vectors OH and OL, from my small observations the price level given by the Fall Line seem to be an interesting "Support" or "Resistance" level. ( Note that, for the moment, I am observing the pattern on the Dax, on 5 minutes bars with 2 hours TimeFrame. Maybe it acts a bit differently for currency pairs ).
This price level given by the Fall Line seems to be a point with more 'energy' than some other random points, if we may say so. Maybe that's why it may particularly attract or reject "price". Also it seems these points tend sometimes to cluster, which may give them even more 'energy'
For example, it seems that :
- if your Fast Long Range MA is above the Slow Long Range MA; and that for the first time after the Fall Line is created**, the Low of a bar (but not an inside bar) has been X points above the Fall line, then the Fall Line seem to be a reliable support level for some points.
- inversely, if your Fast Long Range MA is below the Slow Long Range MA; and that for the first time after the Fall Line is created**, the High of a bar (but not an inside bar) has been X points below the Fall line, then the Fall Line seem to be a reliable resistance level for some points.
** : for the moment, I consider the Fall Line created as soon as the 2 hours elapsed (for example), even if the pattern seems not complete yet, visually. It seems that sometimes the Market already knows that Fall line and will react to it before the parallelogram is cleanly created.
All this is just based on very quick observations, so maybe it is not reliable at all
One question I would have for iDoubleStoch is : if I may ask, according to your knowledge, did you come to understand why these 2 vectors and this pattern make sense regarding price ?
...This is true when you start comparing 1st vs 3rd swing. You can either trade the 3rd or 4th swing swing as you almost know how far the 3rd swing can go.
Ignored
An interesting perspective on Elliot. I've never used range bars, nor have I properly explored them. They have been one of many interesting Price-to-Time concepts that I have always wanted to explore but never really made the time and commitment to study.
Keep creating and explore the unconventional! That's the important thing.
F-X-C-M | A Classic Retail Bucket Shop Scam Artist Who Manipulates Prices
|
Joined May 2012
|
Status: Working the mine.
|404 Posts
Mr double the stock...oops...
have you looked at purely geometric trading, like beck's emblem for instance? Looks very interesting. I've never seen anyone try to mimick beck's emblem in MT4. It has to rotate when the chart is zoomed in and out to be able to line it up over the price\candles. Very good for guessing the "D" in harmonic trading. Plus, it has the other parts of the equation, like vector, impulse, timing, etc.
...I still feel a bit stuck, like going in circles, regarding the developping of a reliable strategy.
Ignored
I selected an unconventional path for research from the very beginning after plowing through a lot of standard/conventional technical analysis. The reasons that some trader's have difficulty gaining traction are myriad. For many it is purely psychological and emotional. For others it seems too technical and too demanding. Some have difficulty getting beyond retail bucket shop business models designs to see them fail.
There are people out there who can take two indicators and scalp their butts off. I sat with a trader in a coffee shop one day and watched him demonstrate his scalping abilities to my amazement. He was not born that way. However, he spent an enormous (HUGE) amount of time, energy and effort into developing the skills necessary to do what he does routinely and without fear. He's like a Ninja Scalper. I can't do what he does because I have not focused on the specific areas that he's spent so much time focusing on.
The paradox about trading is that it is both easy and hard at the same time. It is easy, but ONLY after you've developed the skill to make it so. It sounds convoluted but only after you come out on the other side, do you realize the truth of the statement. Trading is easy, but you have to make it easy and that requires a lot of work. I am not talking about Swing Trading or Position Trading. I'm talking about down in the trenches Intra-Day Trading. To do that successful each day requires skills, tools and a specific trader's psychology (mentality) to match.
...For example, it seems that : - if your Fast Long Range MA is above the Slow Long Range MA; and that for the first time after the Fall Line is created**, the Low of a bar (but not an inside bar) has been X points above the Fall line, then the Fall Line seem to be a reliable support level for some points. - inversely, if your Fast Long Range MA is below the Slow Long Range MA; and that for the first time after the Fall Line is created**, the High of a bar (but not an inside bar) has been X points below the Fall line, then the Fall Line seem to...
Ignored
Basically, showing you the retracement level before rejoining the dominant "trend." So, you have figured that out which is good. It means you carefully looked at it. Very good!
This price level given by the Fall Line seems to be a point with more 'energy' than some other random points, if we may say so. Maybe that's why it may particularly attract or reject "price". Also it seems these points tend sometimes to cluster, which may give them even more 'energy' **
Ignored
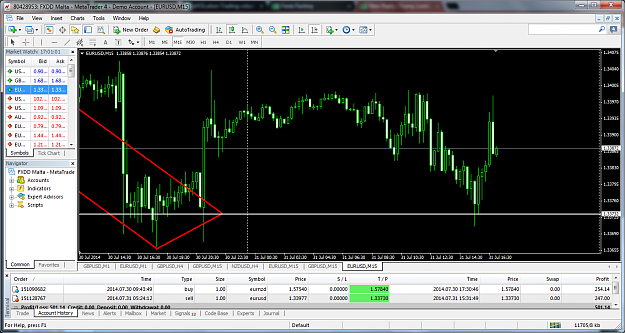
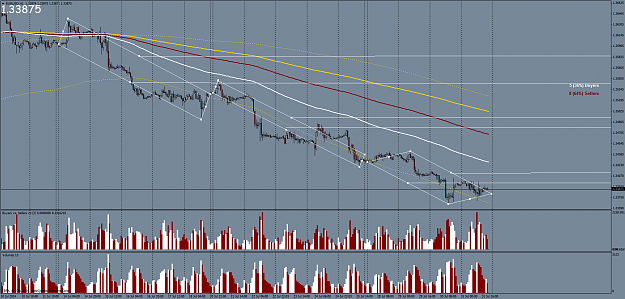
I think it was EURJPY or GBPJPY, a while back ago in this thread (I am not sure) that was producing clusters of Fall Lines near the same level and I said that such behavior was an indication that a big move was imminent. 7/30/2014 provided that big move. It completely changing the complexion of the entire week for the EURJPY. So, yes - these Fall Lines are very interesting "locations" in the market and when they start to cluster, typically something big is imminent:
...if I may ask, according to your knowledge, did you come to understand why these 2 vectors and this pattern make sense regarding price ?
Ignored
Yes, but I cannot divulge such things because it gets too much into the mechanics of the production Version 5.x of the B2i that I use in my system. What I am sharing here is Version 1.0.
However, keep exploring and playing with it. That's how you develop good tools and it could help you to create a good method that I know nothing about. Share what you can, but keep your production edge close to the vest when you find one. This thread is here to inspire creativity in others and to that end, I hope you've gleaned something of value. Cheers!
F-X-C-M | A Classic Retail Bucket Shop Scam Artist Who Manipulates Prices
...have you looked at purely geometric trading, like beck's emblem for instance?
Ignored
Yes. I am familiar with Ross, and I have long ago looked into "Becks Emblem." I looked at that during the period of time I was studying other harmonic based methods. Before you ask, the answer is no. The B2i Pattern is not Beck's "Quadrilateral." If one takes a close look at the Quadrilateral, its starting point does not use the Open price and does not have to have extremes on both sides (top and bottom) of the Open, like B2i does:
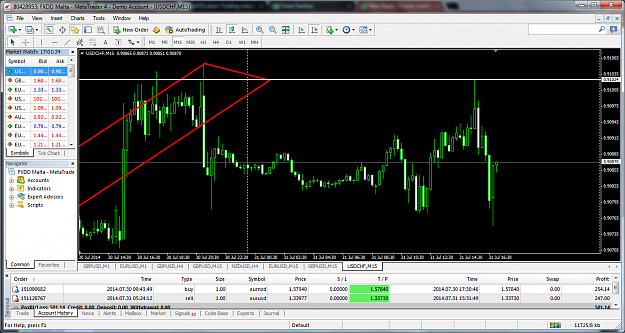
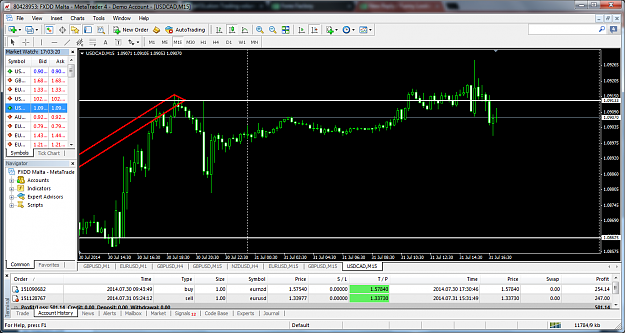
However, the Quadrilateral that Beck's uses in his geometric emblem might provide a differential signal depending on where price exits the B2i box. As you can see in this GBPUSD case on the M15 chart, there is a 3hr B2i plotted between 1815 hrs and 2130 hrs, yielding a Fall Line at a price level not very different from Beck's Quadrilateral entry point level. Beck's Quadrilateral entry point signals a Short, while price action within the B2i structure upon exiting the box signals Long to the Fall Line. This essentially creates confluence between the Quadrilateral signal and the B2i Fall Line target. Overhead, the OS1 is biased to the Short side. This would provide three (3) indications of price Direction coupled with two (2) Timing events.
So, when analyzed that way, it signals Short in the area of the Quadrilateral entry point, Fall Line target and under Point "D". In this case, that was some pretty effective and well timed confluence:
Looks very interesting. I've never seen anyone try to mimick beck's emblem in MT4.
Ignored
The two pics above shows that they are not mirror images of each other, but entirely different concepts predicate on an entire different set of structural points of order. The Quadrilateral by definition cannot extend point "C" below point "A." Thus, it cannot qualify as a valid B2i pattern. B2i must have two extreme points that show up on both sides of the Open price. The Quadrilateral must be anchored at point "A," which by definition cannot be the Open price start point for B2i.
They are quite different. They just happened to coincide in this particular example with entry levels that showed confluence.
It has to rotate when the chart is zoomed in and out to be able to line it up over the price\candles. Very good for guessing the "D" in harmonic trading. Plus, it has the other parts of the equation, like vector, impulse, timing, etc.
Ignored
I like Ross's work, though I am not a practitioner of the "sacred" aspects of harmonics, I do see empirical evidence for that which has been called "Harmonic Patterns" in the market - especially the currency markets. We see it in the two pics above yet again and we are unable to escape harmonics no matter how hard we try.
F-X-C-M | A Classic Retail Bucket Shop Scam Artist Who Manipulates Prices
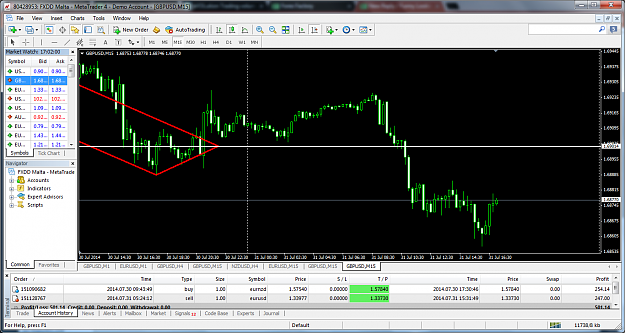
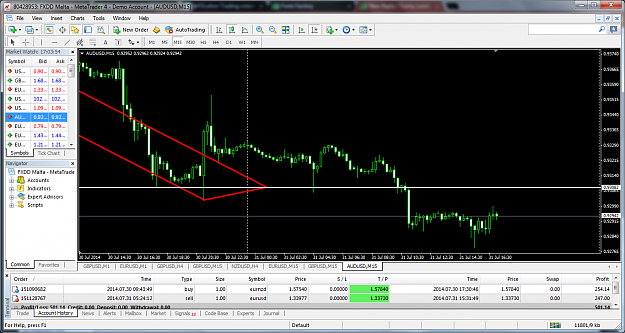
Once the O:H and O:L have been established and price reels back into the mirrored leg on the opposite side of the structure like this, it can be a good early warning trigger and a great entry window. Why?
A) If price continues to reel higher, even establishing a new Higher High, then the Fall Line is still BELOW the point of entry. Maximum logical protection.
B) If price stops after it penetrates the opposite mirrored leg and then moves down, it initiates the profit phase sooner rather than later.
C) The only thing that can prevent a successful trade in that situation would be if the pattern itself was an historically anomaly.
You've been looking for ways to enter the pattern more fluidly while preserving potential profit and reducing risk. This is one of those ways. It is almost like cheating or stealing but without the guilt. If the structure establishes correctly, it provides you with something of a stealthy unfair advantage.
F-X-C-M | A Classic Retail Bucket Shop Scam Artist Who Manipulates Prices
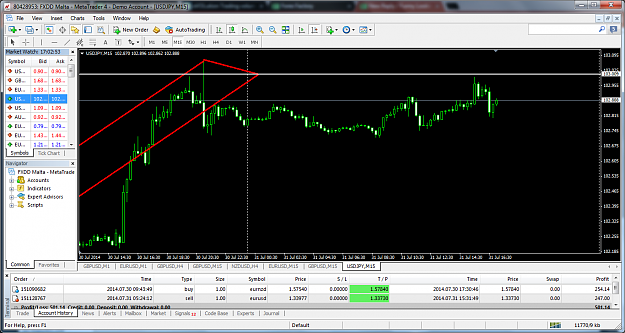
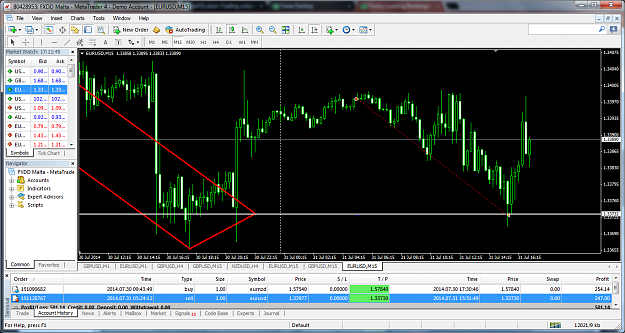
The two features that I don't like about this one are the distance between the level at which the O:L mirrored leg as been breached and the actual Highest High. So, if price were to continue going higher from here, you'd have to have the capacity to endure such draw on the trade and then you will have to extend the range of the B2i itself. Why? Because, price has not seen the Fall Line yet, so empirically (according to history) the pattern would still be in effect. The second feature that I don't particularly like about this early warning is the distance between real-time price and OS1 Green. I'd like to see real-time price closer to OS1 Green which makes a return to the downward bias more probably from this location.
Another factor to note on this is the fact that we are now at the end of the week and GBPUSD has been down all week. Sellers want to take profits and anti-trend trader's want a new pony to ride. That should have some upside net effect on Friday's price action and make this B2i wander a bit. Recall what I said about knowing the Market Phase the pair is in during your entry into a trade. That's important at all times, but especially during end of week Day Trades.
These are all caveats that really belong to a higher version of B2i than I am able to share at this time. However, at least it provides you with some bigger picture understanding of other inputs that surrounding B2i.
F-X-C-M | A Classic Retail Bucket Shop Scam Artist Who Manipulates Prices
{quote} An interesting perspective on Elliot. I've never used range bars, nor have I properly explored them. They have been one of many interesting Price-to-Time concepts that I have always wanted to explore but never really made the time and commitment to study. Keep creating and explore the unconventional! That's the important thing.
Ignored
Thank you for your compliments. Yes I kinda made Elliot wave 'practical' instead of theory.
{quote} I think it was EURJPY or GBPJPY, a while back ago in this thread (I am not sure) that was producing clusters of Fall Lines near the same level and I said that such behavior was an indication that a big move was imminent. 7/30/2014 provided that big move. It completely changing the complexion of the entire week for the EURJPY. So, yes - these Fall Lines are very interesting "locations" in the market and when they start to cluster, typically something big is imminent: EURJPY | 7/28 - 7/29 Leading to 7/30 Explosion: {image}
http://i60.tinypic.com/2zdnocn.png
... with statistics to back it up. Those 50-60% retracement areas and 100-120% extension are really key areas to watch for major support and resistance at least 80-90% of time, but it also funny to see how price almost moves via nothing but Fibonacci related numbers e.g. 61.8% alone.
I do have a little problem with fixed timeframes, that I can't exactly find a way to determine where the start and end of the box is. I've noticed that sometimes it follows 'the start and end' of the typical day, and sometimes it doesn't e.g. like as in your picture, it overlaps onto the next day. I am not fully sure how you got around this problem.
So I kinda got around the problem by using range bars to filter for 'significant price action'. I can use my wave indicator on standard time based candles e.g. M15, but to me it appears to map out PA that I actually can ignore. To the extent.... I no longer use 'Timeframes' in a sense... but 'Priceframes'. But I still believe there must be some value to fixed timeframes, especially just the daily bars. Am I not searching deep enough?
Joined Jan 2014
|
Status: Google is a wonderful tool
|130 Posts
Hi iDoubleStoch,
I had a bit of a basic and 'theory based' question if you don't mind. I'm in the camp of people who believe they don't quite have the right 'technical knowledge' or eye to make it so I'm hoping you can offer some words of wisdom in that area (I've read so much today I've already forgotten where you posted about it).
So far I've only really glanced at the charts and the rectangles, and to me I see:
-HO/OL/HC/LC mapped out(Which I believe are the leading/trailing long/short trajectories if I recall correctly)
-Horizontal projection line stemming from HC/LC vector
-Assumption that trades are taken via some filter/filters involving other 'signals' and MTF analysis.
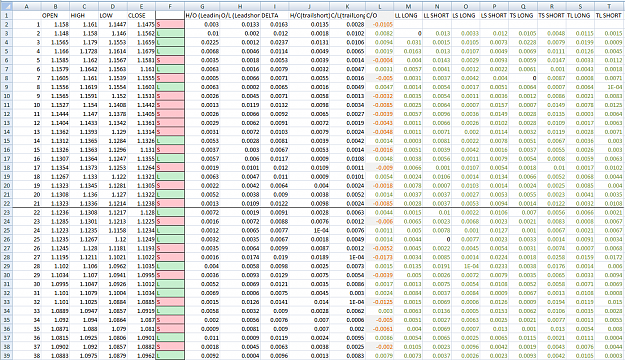
Attached is a picture that I think for you speaks for itself; the beginnings for all newbs. My question, if it can be phrased into one question is, How do you get form point A to point B? First I'll say that I know that what you were working on even 5 years ago was leagues above the attached picture. I've explored a number of the things you spoke about (basic TCDs, EMA Fill %), but even in those basic outputs I never saw something that stood out to me. Charting any of the trajectories always produced the same sort of oscillation (between say overfill/underfill) and I was always left kind of staring at a bunch of numbers in an excel doc.
Lately I've been fortunate enough to receive a little help and have "seen the light" that is moving from looking at a 'x delta' or 'average of x delta' to looking at a 'signal light' that is produced from what is essentially an overfill/underfill on two separate deltas when compared to an average of a third delta. However even in this form I could not "see" anything until it was produced in lines and boxes on a chart. More over, I could not foresee myself even attempting such a comparison between so many strings of metadata (I suppose I struggle a lot with trying to work with data in a way that produces something that makes sense to me. There are an endless number of permutations that you could perform on data, but at some point you will end up with gibberish output).
Are you just good with numbers and can see a relationship in the columns of output that excel produces? Or is there another way that you coax the hidden 'patterns' to appear? How do you know when the output produced has results that are worth looking into more?
Also a huge Thanks! for all your contributions over the years.
...I do have a little problem with fixed timeframes, that I can't exactly find a way to determine where the start and end of the box is. I've noticed that sometimes it follows 'the start and end' of the typical day, and sometimes it doesn't e.g. like as in your picture, it overlaps onto the next day.
Ignored
You are dong the right thing with empirically flushing out best-case Fibonacci levels. Going after theories with statistically based proofs is the right way to conduct research, no matter what kind of technical indicator you are studying. If it is technical, then it has empirical evidence, good or bad. I like the organized and numbers driven approach you take.
The Standard B2i has a fixed starting point. It is the Open price of the bar where you wish to start the B2i range. The B2i "range" is nothing more than the number of bars between the Open price where you began the range and the last point of expansion. The last point of expansion is either the Highest High, or the Lowest Low. Which one depends on the Shape of the box the market provides. Inside the box, either the Highest High will come first followed lastly by the Lowest Low. Or, the Lowest Low will come first, followed by the Highest High. The B2i "range" ends with the last point of expansion, where the number of bars between the last point of expansion and the Open price, defines the Time of the range. The Standard B2i use standard MT4 charts and you typically want to paint the B2i box on in a chart time that is smaller than the range of the B2 itself. That means that a D1 B2i can be painted on any time frame smaller than the D1, so that you can witness the detail in the price action - if you want to.
A Hybrid B2i, also has the same Open starting point, but instead of selecting expansion points (Highest High and Lowest Low) within a standard time frame, you can select any Highest High and any Lowest Low to define the range, as long as the Highest High point of expansion is higher than the Open starting point and the Lowest Low point of expansion is also lower than the Open starting point. The Primary Trajectories are the two (2) lines you draw from the Open price to the HH and the LL. Those two lines are Mirrored and Shifted. The O:L primary line is Mirrored and Shifted UP, while the O:H primary line is Mirrored and Shifted DOWN. This Mirroring and Shifting of the Primary Trajectories is what seals the box and establishes its Shape. That Shape remains sealed unless or until either point of expansion is extended by the market - pushing the HH further up, or the LL further down.
Where the two Mirrored and Shifted lines meet is called the Projected Intersection which produces the Fall Line, if you select the Neutral (Standard) Target Level. The Fall Line changes quite a bit, if you select the Positive Slope Fall Line or Negative Slope Fall Line as your target (this requires real-time tracking either manually or via EA, as there is no way to enter a dynamic limit order without your trading platform being aware of the exact slope of the line).
Whether or not any B2i has an Intersection that extends out in to the future, or as you say "overlaps," is purely a function of the B2i range that either you select, whether a Standard Time Framed B2i (HH and LL must fit within a standard time frame), or a Hybrid Time Framed B2i (HH and LL can extend over any custom time frame).
That should you better understand how to construct Standard and Hybrid B2i patterns.
So I kinda got around the problem by using range bars to filter for 'significant price action'.
Ignored
B2i is based on where price has been and what the market has done. I have not used range bars at all in my work, but the idea does sound intriguing. So, explore it if you want and do let us know what you discover!
F-X-C-M | A Classic Retail Bucket Shop Scam Artist Who Manipulates Prices