weekly chart of E/Y. Closed with red candle and price is near 50 ema. Once price breaks and closes below, I reckon we will get a nice downtrend. CCI has just crossed below 0 for a sell. On the daily( bottom chart), price is below 200ema( turning down now) and the 50 ema is pointing south. Therefore, I remain bearish {image} {image}
Ignored
Now I understand why you short EJ, GJ and keep order to next week. Thank you for sharing
{quote} Now I understand why you short EJ, GJ and keep order to next week. Thank you for sharing
Ignored
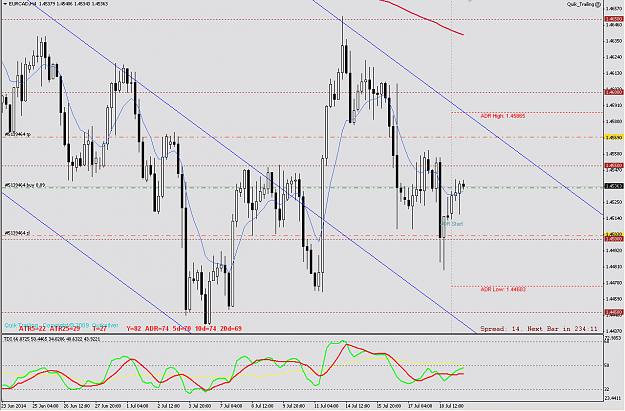
I don't have G/Y anymore. Price rose and took my SL at b/e+5. However, I do have E/Y and I shorted Cad/Y after coming out of G/Y. For Cad/Y I am hoping the top end of the channel on my chart will hold. I reckon Cad weakness might continue to follow at least for the next couple of days. Yeah, my N/U shorts underwater at the moment
RE-entered this trade last night when everybody else was not around. 1 position on N/U was taken out with wide spread and spike when Sydney opened. Re-entered another position. Underwater now. Cad/Y in green and E/Y yellow/red
G/u on H1 looking like a good short if we get a close below the pivot in 10 mins time. On H4 will be a bearish engulfing candle. Just you wait, only 10 mins to go
G/u on H1 looking like a good short if we get a close below the pivot in 10mins time. On H4 will be a bearish engulfing candle. Just you wait, only 10 mins to go
Ignored
I hear ya pips.... but GU always looks like it wants to bite me...lol.... unless I see a signal engraved in gold I'm not budging ...
{quote} I live in the North. Have you ever come to VN?
Ignored
yes, I was in Hanoi a few years ago. I went to hualong bay, around the islands and at that time, Ms Universe or Ms World was being held there. I also went on a small boat manned by a young girl father and her father who can use his legs to row the boat. I don't remember the name of this place but I can't forget that I have to lie down when passing thru some "openings" where the distance between the water and the "floor" of the gap was about the height of the boat. I had photos taken by a photographer who came in a motorboat. I seem to have misplaced those photos. I intend to go to Ho Chi Min city one day soon