Bubble in the US Stock Market ? A few suggestions.
Every economist has his own definition of what bubbles are. While Fama would deny their existence at all, but then Christina and David Romer will say the following:
"Definition of a “Bubble”: An excess of asset prices over their fundamental values."
Same, but in a different manner would be suggested by Gertrude Tumpel-Gugerell, Member of the Executive Board of the ECB at alumni event of the Faculty of Economics at University of Vienna, 3 May 2011:
"But how can we define bubbles more accurately? One way to do so is as a deviation of the value of a financial asset from its ‘correct’ or ‘fundamental’ value. Broadly speaking, the ‘fundamental’ asset price is equal to the net present value of the cash flows which the owner of the asset is entitled to receive."
Robert Shiller, The Nobel Prize winner would say...
"After all, a bubble is a form of psychological malfunction."
The more economists, the merrier definitions. The tricky thing is, it's impossible to confirm which definition is the correct one. While in Physics and Chemistry scientists can observe different processes occurring throughout controlled experience, in economics those things are only fiction.
Of course, I'll add something to this story. Bubbles are specific economic phenomena resulting from rapid increase in money supply relative to the amount of goods and services. These phenomena divert resources from their most productive use to a less productive use. Bubbles are unsustainable and are inevitably followed by busts.
Is there a bubble in the U.S. stock market?
First, the quantitative easing policies directly increase the monetary base and create conditions for rapid growth of money supply. In other words, the necessary condition for the creation of a bubble is present. Then we should look for signs of growing influx of money to a sector, namely faster increase in the price of an asset relative to other assets.
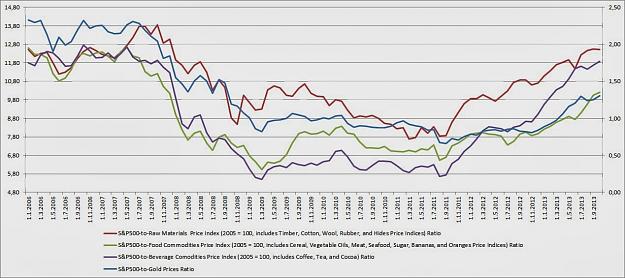
Attached Image (click to enlarge)
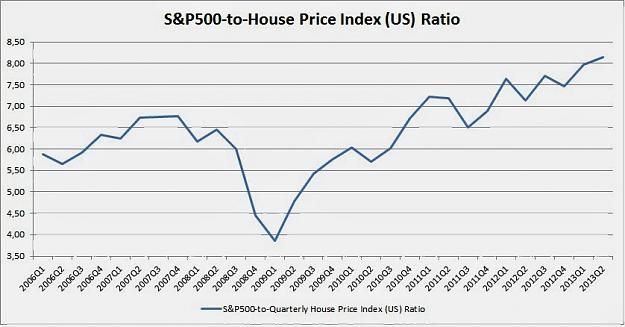
Attached Image (click to enlarge)
S&P 500 began to rise faster than most commodities (including gold, oil and real estate) after September 2011. It is important to keep in mind that the only way for the prices of most of the stocks to increase in the long run is if, and only if there is a fresh amount of new money constantly pumped into the system. That relatively more intensive rise in stock prices, compared to other markets shows that the majority of the newly created money in the banking system are flowing into the US (and not only US) stock market. The imbalance in question (or let's say the lack of balance) is the first significant signal for the formation of a bubble in the US stock market after 2011. This lack of balance however can not exist forever. Whether the infusion of new money in the stock market is shifting resources from more productive to less productive sectors is difficult to say at the current moment. Business Insider shows the 10 stocks which has risen mostly since the previous historical high in 2007.
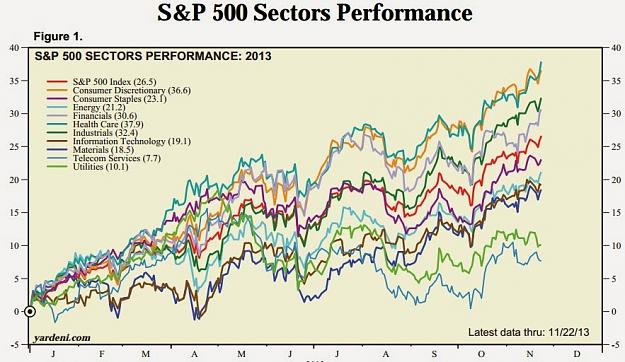
Attached Image (click to enlarge)
For 2013, Consuming and Health care are leading industries in S&P 500. However, the time period is sufficiently not enough to conclude anything at this point.
U.S. Federal Reserve has definitely achieved its goal, namely, to restore consumer confidence (and the subsequent consumer spending, which is of course the good old mantra) by the so-called wealth effect - when the value of household assets exceeds the value of their liabilities, wealth grows together with consumer spending. What has been neglected in this case however is that rising stock prices are not due to a greater business efficiency, but to the newly pumped money into the financial system.
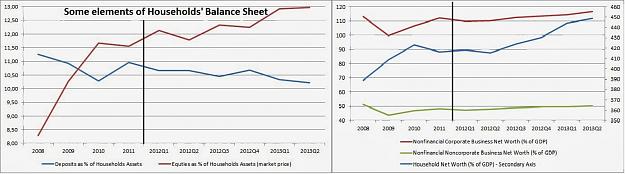
Attached Image (click to enlarge)
There is still a potential to reduce the share of deposits (savings) in the proportion of household assets at the expense of the corporate equities. In other words, the bubble is just about to be inflated in the future. However, there are some tentative signs of progress in those phases in which optimism and the rate of the bubble's distention will move to a higher level. We're about to discuss those signs in the near future. Although every statement about the existence of a bubble before seeing it bursting can be considered as some sort of exorcism, we can conclude that there is noticeable optimism in the US Stock market, which is not supported by the economy fundamentals.
Sources: IMF, FEDERAL RESERVE STATISTICAL RELEASE, FRED Economic Data, Yardeni Research, Inc.
There is a case for expecting a switch in the notion which equities are more reliable - the European or the US. The prevailing opinion till recently was that us equities are more fundamentally supported. But following the QE policies, some analysts consider switching sides. It will be quite ambitious, however, to try to forecast such a change in the preference of investors worldwide here and now. Instead of doing that, I decided to check how are the stock returns in European and US equities distributed for the last, let's say approximately 30 years.
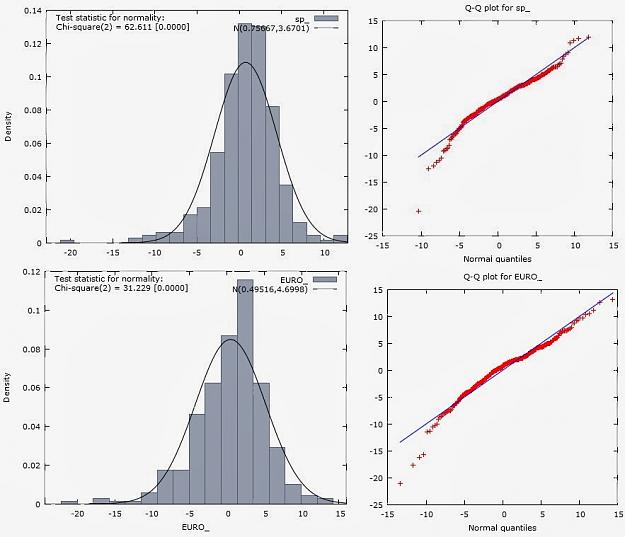
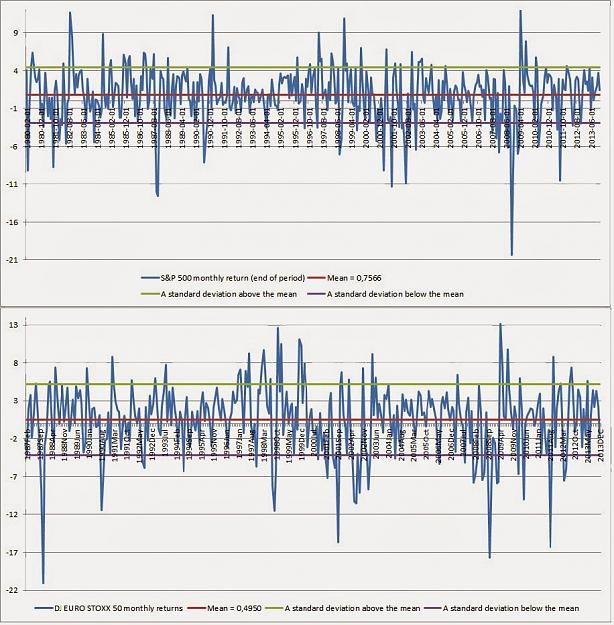
So I gathered the monthly returns of S&P 500 (from 1980 to the end of 2013) and DJ EURO STOXX 50 (from 1987 till the end of 2013) and checked for data normality.
Attached Image (click to enlarge)
Having the frequency distribution and the Q-Q plots allows us to say that the data is normally distributed. Thus we can calculate the means and the standard deviations, which will represent respectively the average monthly return and the volatility of the stock market index throughout the observed time period. Now, what are those results telling us about the data ?
Attached Image (click to enlarge)
First we will notice that the average monthly return of S&P 500 (0,75%) is higher than of the DJ EURO STOXX 50 (0,49%), which is essentially telling us that if you had chosen to invested your money in US (instead of European ) equities in the early 80's, then you would have harvested higher capital gain today. In other words, US equities have been more attractive since the 80's. We should mention here that this does not tell us absolutely nothing about the future, since human action does not stick to a constant quantitative perceptions. It's history that we're talking about here. Nothing else.
Second, the standard deviation of DJ EURO STOXX 50 (4,699) is higher compared with S&P 500 (3,6700), which implies also higher market volatility of the European equities. To confirm the statistics visually, our conclusion can be observed on the chart above.
So, then, it turns out that the representative US equity market index has had higher monthly returns (on average) and lower volatility, compared to the index, representing the European equities.
Attached Image (click to enlarge)
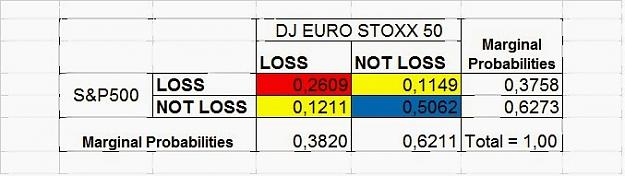
In addition to the conclusions already made we post a joint and marginal probability table of S&P 500 and DJ EURO STOXX 50 for the period 1987 to 2013 to check for the expected co-movements between the two indexes. It's shown that half of the time both indexes have registered positive returns (NOT LOSS), while only 26% of the months have negative returns (LOSS) in both indexes.
Finally, there's room to say that we can't tell whether European stocks are gonna be more attractive than the US in the future. However, we can say that for the last 30 years US stocks have performed slightly better in comparison with their European relatives in terms of monthly returns and volatility.