Hi Rea. Maybe this will help a bit:
Start with a 30 pip chart, zoom out so that you have either a prominent high or low, then use the red line as a boundary. Connect each pair of bricks that have opposing wicks that are at extremes, as you cross over and back on the red line. Don't try to do any analysis, just relax and go from one extreme to the other as you cross the red line and join the opposing wicks
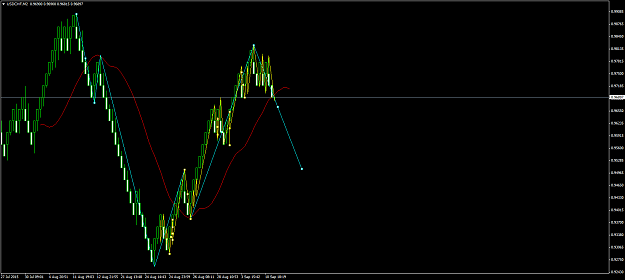
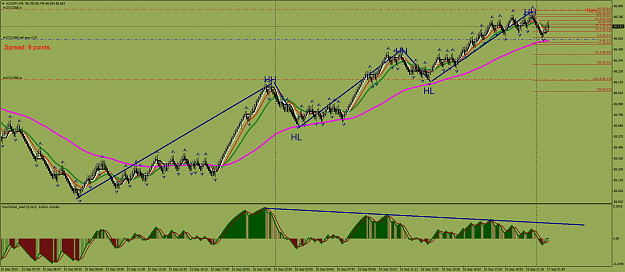
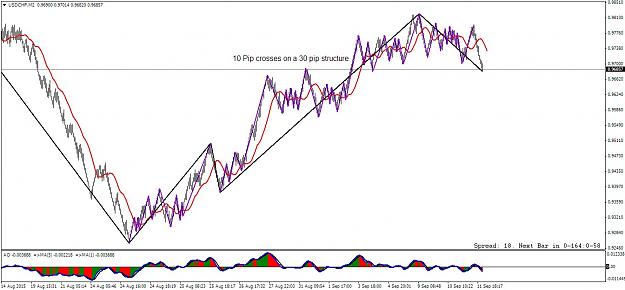
The first chart is the recent 30 pip bricks USDCHF.
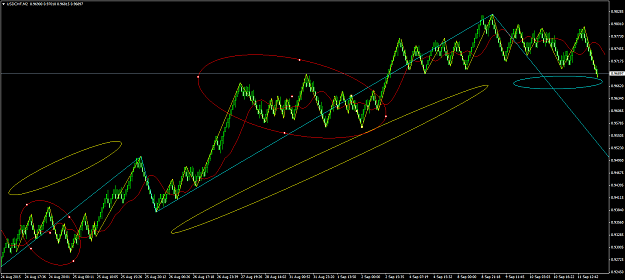
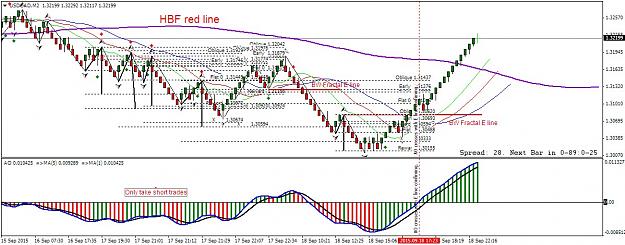
Now change the chart to a 10 pip brick chart. The 30 pip waves will still be visible. Use a different color (I used purple) and repeat the exercise joining the extremes of the opposing wicks again.
I zoomed in a bit here to makes sure you can see it better.
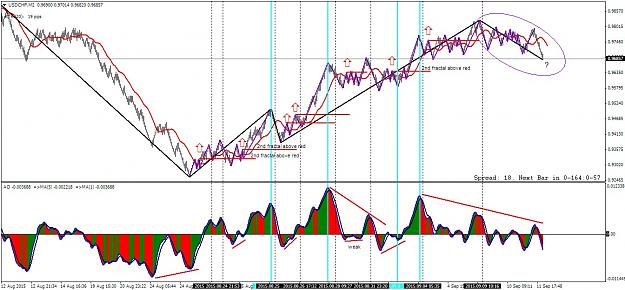
You now have two degrees of waves to examine. There are even smaller waves inside of the purple ones, but don't worry about them at this point.
Once you have the larger waves (black) and the internal waves (purple) try your HH HL LL LH counts on each, bearing in mind that there is a black structure with an internal purple structure. Sometimes they will overlap and share a wave.
The internal structure can have an occasional zigzag type of reversal, that stops after a brief probe against the bigger trend and then continues in the direction of the larger structure. You will find that those throw you off but the bigger structure asserts itself and off it goes again
I hope that this exercise helps. Remember, draw the lines in relaxed frame of mind and only then try to figure out the sequence.
Most of us try to do it the other way around. When you are relaxed it becomes an art exercise and it reveals itself better
when you switch to the analytical side. People who are really left brained (strongly right handed) find this visual stuff difficult.
I hope that helps. It can be a bit like not seeing the forest for the trees.
Zoom out before you start, it is very important to get the big picture before you start.
Good luck.
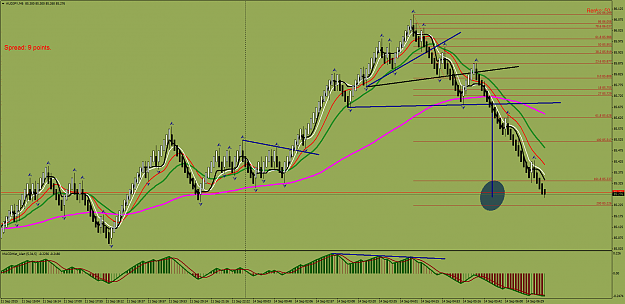
Start with a 30 pip chart, zoom out so that you have either a prominent high or low, then use the red line as a boundary. Connect each pair of bricks that have opposing wicks that are at extremes, as you cross over and back on the red line. Don't try to do any analysis, just relax and go from one extreme to the other as you cross the red line and join the opposing wicks
The first chart is the recent 30 pip bricks USDCHF.
Attached Image (click to enlarge)
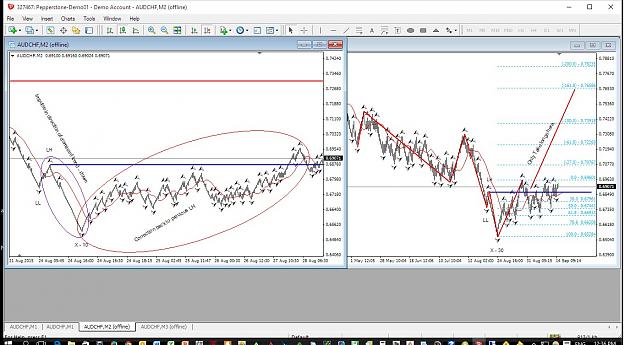
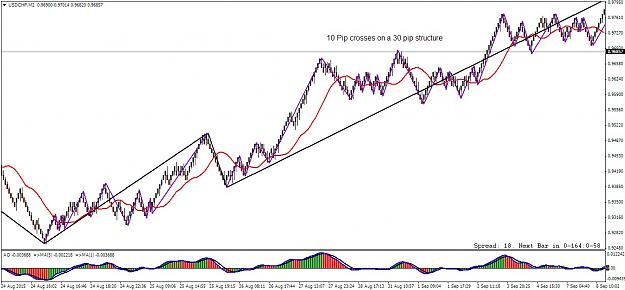
Now change the chart to a 10 pip brick chart. The 30 pip waves will still be visible. Use a different color (I used purple) and repeat the exercise joining the extremes of the opposing wicks again.
Attached Image (click to enlarge)
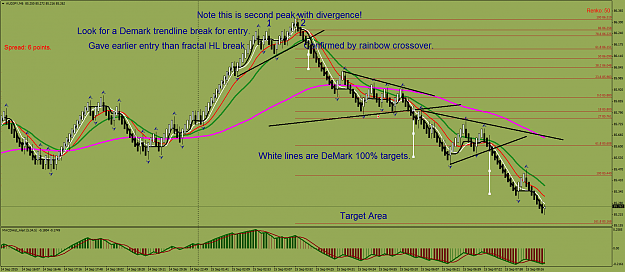
I zoomed in a bit here to makes sure you can see it better.
Attached Image (click to enlarge)
You now have two degrees of waves to examine. There are even smaller waves inside of the purple ones, but don't worry about them at this point.
Once you have the larger waves (black) and the internal waves (purple) try your HH HL LL LH counts on each, bearing in mind that there is a black structure with an internal purple structure. Sometimes they will overlap and share a wave.
The internal structure can have an occasional zigzag type of reversal, that stops after a brief probe against the bigger trend and then continues in the direction of the larger structure. You will find that those throw you off but the bigger structure asserts itself and off it goes again
I hope that this exercise helps. Remember, draw the lines in relaxed frame of mind and only then try to figure out the sequence.
Most of us try to do it the other way around. When you are relaxed it becomes an art exercise and it reveals itself better
when you switch to the analytical side. People who are really left brained (strongly right handed) find this visual stuff difficult.
I hope that helps. It can be a bit like not seeing the forest for the trees.
Zoom out before you start, it is very important to get the big picture before you start.
Good luck.