Invest Under BrightGlobalFx Click her►
The closing price has a bigger influence on Woodie's Pivot Point as it does on the Exponential Moving Average. Many traders believe that the high and low prices are a result of emotions in the heat of the battle, while the opening and closing prices are a more accurate representation of the mood of the market. The best way to show the difference is to calculate both Pivot Points for the February 24th session. The Classic Pivot Point is calculated using the high, low and closing prices from February 23rd, which for the EUR/USD were:
High - 1.3691
Low - 1.3496
Close - 1.3504
The formula for calculating the Classic Pivot Point is to simply add these three price levels and then to divide by three.
1.3691 + 1.3496 + 1.3504 = 4.0691/3 = 1.3564
Woodie's Pivot Point is calculated by using the high and low prices from February 23rd and the open price from February 24th, which for the EUR/USD were:
High - 1.3691
Low - 1.3496
Open - 1.3504
It is not unusual for the close from one session to be the same price as the open for the next since the FX markets trade 24 hours a day.
The formula for calculating the Woodie’s Pivot Point is to simply add the high price to the low price and then to add the opening price twice, and then to divide by four.
1.3691 + 1.3496 + 1.3504 + 1.3504 = 54195/4 = 1.3549
You can see how the most recent price is given greater emphasis in Woodie's Pivot Point formula, much the same way an Exponential Moving Average emphasizes the most recent closing prices over earlier closing prices in its calculation.
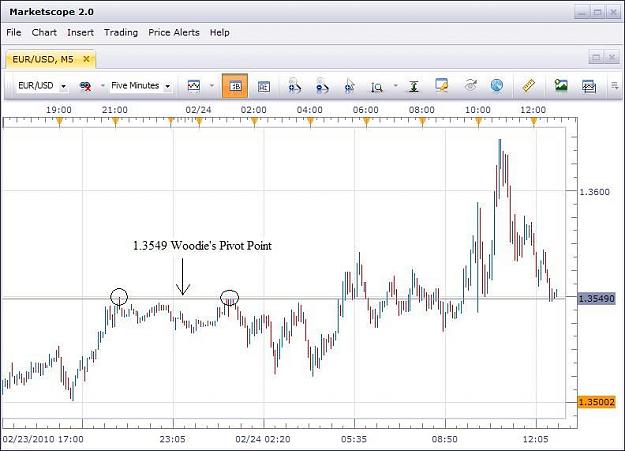
This 5-minute chart of the EUR/USD shows how the 1.3549 Woodie's Pivot Point offered resistance before the eventual break up through that level as a result of the release of a scheduled US economic report . The market opened below the Pivot Point, so the trader would initially have a bearish bias, meaning that looking for sells was the preferred play
The closing price has a bigger influence on Woodie's Pivot Point as it does on the Exponential Moving Average. Many traders believe that the high and low prices are a result of emotions in the heat of the battle, while the opening and closing prices are a more accurate representation of the mood of the market. The best way to show the difference is to calculate both Pivot Points for the February 24th session. The Classic Pivot Point is calculated using the high, low and closing prices from February 23rd, which for the EUR/USD were:
High - 1.3691
Low - 1.3496
Close - 1.3504
The formula for calculating the Classic Pivot Point is to simply add these three price levels and then to divide by three.
1.3691 + 1.3496 + 1.3504 = 4.0691/3 = 1.3564
Woodie's Pivot Point is calculated by using the high and low prices from February 23rd and the open price from February 24th, which for the EUR/USD were:
High - 1.3691
Low - 1.3496
Open - 1.3504
It is not unusual for the close from one session to be the same price as the open for the next since the FX markets trade 24 hours a day.
The formula for calculating the Woodie’s Pivot Point is to simply add the high price to the low price and then to add the opening price twice, and then to divide by four.
1.3691 + 1.3496 + 1.3504 + 1.3504 = 54195/4 = 1.3549
You can see how the most recent price is given greater emphasis in Woodie's Pivot Point formula, much the same way an Exponential Moving Average emphasizes the most recent closing prices over earlier closing prices in its calculation.
This 5-minute chart of the EUR/USD shows how the 1.3549 Woodie's Pivot Point offered resistance before the eventual break up through that level as a result of the release of a scheduled US economic report . The market opened below the Pivot Point, so the trader would initially have a bearish bias, meaning that looking for sells was the preferred play
Attached Image (click to enlarge)
BRIGHTGLOBALFX