hey every one
i have an idea
as all we know the old way to calculate the daily range or movement is by measuring the difference between high and low
but my idea is to calculate how much pips did the price (( walk )) during the day
how this is calculated ???
as we all know any day consist of candles whatever the time frame (( 1hr, 30min ...... etc )) but as long as you use smaller time frame you get more accurate calculation
let's say we will use 1hr candle so we will have 24 candles during the day
we will calculate how much did the price move in every 1hr candle and then (( sum )) the 24 candle to get the amount of pips that the price (( walked )) during the day
how will we calculate the movement in every candle ?? is it the difference between the high and low of the candle ?? no it's different
see the attached image
do you see this green candle ??? can you imagine how it was created ???
let' imagine
first the price was at 1.5300 ( open of the candle ) then it go down to 1.5200 ( low of the candle ) here the price walk 100 pip
then the price moved from 1.5200 to 1.5500 ( high of the candle ) here the price walk 300 pip
then the price move from 1.5500 to 1.5400 (( close of the candle )) here the price walk 100 pip
so the difference between the high and low was 300 pip
but the total movement happened during the candle was (( 100 + 300 +100 )) = 500 pip and that is what we want
so we need an indicator we put it at any time frame (( from 1hr to 1min ))
the indicator will calculate the movement of every candle (( what ever the time frame of the candle either it was 1hr or 30min or even 1 min ))
the indicator will calculate the lower tail and sum it to the higher tail and then multiply by 2 then sum with them the body of the candle
so the equation to calculate the movement during any candle (( 1hr, 30min, 15min .... 1min ))
is
((lower tail + upper tail )*2) + candle body = candle movement
then we sum all the movements of all candles to get the total daily movement
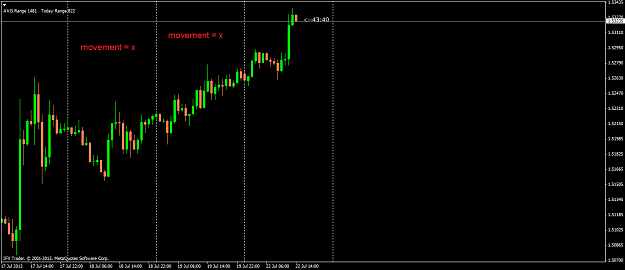
AND FINALLY THE INDICATOR WRITE THE RESULT OF THE CALCULATION AT EVERY DAY AS I MADE IN THE ATTACHED PHOTO WHERE X IS THE NUMBER OF PIPS
i have an idea
as all we know the old way to calculate the daily range or movement is by measuring the difference between high and low
but my idea is to calculate how much pips did the price (( walk )) during the day
how this is calculated ???
as we all know any day consist of candles whatever the time frame (( 1hr, 30min ...... etc )) but as long as you use smaller time frame you get more accurate calculation
let's say we will use 1hr candle so we will have 24 candles during the day
we will calculate how much did the price move in every 1hr candle and then (( sum )) the 24 candle to get the amount of pips that the price (( walked )) during the day
how will we calculate the movement in every candle ?? is it the difference between the high and low of the candle ?? no it's different
see the attached image
do you see this green candle ??? can you imagine how it was created ???
let' imagine
first the price was at 1.5300 ( open of the candle ) then it go down to 1.5200 ( low of the candle ) here the price walk 100 pip
then the price moved from 1.5200 to 1.5500 ( high of the candle ) here the price walk 300 pip
then the price move from 1.5500 to 1.5400 (( close of the candle )) here the price walk 100 pip
so the difference between the high and low was 300 pip
but the total movement happened during the candle was (( 100 + 300 +100 )) = 500 pip and that is what we want
so we need an indicator we put it at any time frame (( from 1hr to 1min ))
the indicator will calculate the movement of every candle (( what ever the time frame of the candle either it was 1hr or 30min or even 1 min ))
the indicator will calculate the lower tail and sum it to the higher tail and then multiply by 2 then sum with them the body of the candle
so the equation to calculate the movement during any candle (( 1hr, 30min, 15min .... 1min ))
is
((lower tail + upper tail )*2) + candle body = candle movement
then we sum all the movements of all candles to get the total daily movement
AND FINALLY THE INDICATOR WRITE THE RESULT OF THE CALCULATION AT EVERY DAY AS I MADE IN THE ATTACHED PHOTO WHERE X IS THE NUMBER OF PIPS
Attached Image (click to enlarge)
Attached Image
