Hi traders!
I trade with some of simple strategies and am showing one of them here.
I believe that this strategy is really simple but logical.
I named it 'Simple Trade with Smart TL'.
In my opinion, TL is the best tool to see the trend.
And TLs which I propose here are smarter than usual TLs.
I am not a native English speaker. I might sound like kids to you. Also this is my first thread.
Sorry in advance. and just call me Zozo.
-Introduction-
This strategy is the contrarian trade with TLs made by SMA(14) on M15. I don't explain how to trade the trend follow here 'cause I think that trading trend-follow and contrarian-trade at the same time makes your brain freezed,then causes many mistaken trades,
also a contrarian trade has more chances to trade than the trend-follow trading.
There is the opportunity to trade once or twice a day in average, not only in UK,US session,also in Asian session.
I'm surely sure that this method is really simple and doesn't make the charts complicated unless you add other indicators.
-Currency: Any, but EUR/JPY and USD/CHF recommended. I explain them on this thread.
-TimeFrame: M15
*This strategy also works on other time frames but I recommend M15.
-Indicators and Download
SMA(14)
*MA method is 'Simple', also apply to 'Close'.
Daily Pivot(For traders who would like to take profit at daily pivot points)
*Do not add other indicators.
-Download
*Zip file is including experts, indicators,profiles,and templates folders.
Copy experts,profiles and templates folders and paste,overwrite into your MetaTrader 4 folders.
You can find 'Simple Trade with Smart TL' in profile folder and see the example trades of EUR/JPY, USD/CHF from 2013.06.18.
*Example trades files (chart.zip) updates once a day at least.

-How to trade
1. Draw smart TLs
2. Wait for the bounce of the TL.
1. How to draw smart TLs *important*
Draw following 4 kinds of TLs along SMA(14). Let's call them Smart TL.
(A)Blue: Outer High TL(OHTL) - Look for the last two high points(in few weeks) made by SMA(14) and tie them.
(B)Red: Outer Low TL(OLTL) - Look for the last two low points(in few weeks) made by SMA(14) and tie them.
(C)YellowGreen: Inner High TL(IHTL) - Draw high TLs in accordance with SMA(14) between OHTL and OLTL.
(D)Pink: Inner Low TL(ILTL) - Draw low TLs in accordance with SMA(14) between OHTL and OLTL.
*Those TLs can not be always drawn.
*Do not use IHTL and ILTL anymore once SMA(14) breaks them.
*You can draw a few IHTLs/ILTLs, but OHTL and OLTL should be one by one.
2. How to discriminate the bounce of TL, and start trading
-Buy
The price hits the OLTL/ILTL(Red/Pink) and bounces,
or the price breaks the OLTL/ILTL(Red/Pink), but SMA(14) doesn't break it,
then the price closes above SMA(14), GO BUY.
-Sell
The price hits the OHTL/IHTL(Blue/YellowGreen) and bounces,
or the price breaks the OHTL/IHTL(Blue/YellowGreen), but SMA(14) doesn't break it,
then the price closes above SMA(14), GO SELL.
-TakeProfit
Daily Pivot Points(recommended), touch other TLs, or just 20,30,40 pips as you like, it's up to you.
-BreakEven
Set 20,30,40 pips or as you like, it's up to you if you want to use BE.
-StopLoss
SMA(14) breaks one TL, or just 20,30,40 pips as you like, it's up to you.
-Example trades
EUR/JPY
USD/CHF
-Caution
Do not add other indicators, or your brain might be confused. I'm showing the simple method, I don't want to make the chart complicated.
If you can not draw TLs well, that day is not the day to trade.
Just wait for the next day or try EUR/USD or GBP/USD.
My purpose here is to simply trade without any confusing ideas.
The Chart should be beautiful. Love the chart and be a chart artist!
Please remember it.
-Tips
If you can not draw IHTL/ILTL(YellowGreen/Pink), it could mean that trend would continue going up/down. So you'd better wait for the price bounce at the LTL/HTL.
Outer TLs are stronger than inner TLs.
To see the whole chart, use ZoomIn(+),ZoomOut(-),Scale fix(F8-Common-ScaleFix)
(I'll add tips when it comes to me...)
Keep calm and let's have a cool trading!!
-EA
For those who don't have enough time to trade, I just made the Simple Trade with SmartTL with EA.
This EA works to start trading at TLs regardless SMA(14)
EA is from this thread. Read how to use this EA from this thread.
Put TrendLine_EA_v37.mq4 into experts folder.
I recommend to use only BlueLine and RedLine.
template:
Buy: RedLine
Sell: BlueLine
Close: BlueLine/RedLine
TP: 0Pip
BE: 0Pip
SL: 30Pips
You can change the settings as you like.

I trade with some of simple strategies and am showing one of them here.
I believe that this strategy is really simple but logical.
I named it 'Simple Trade with Smart TL'.
In my opinion, TL is the best tool to see the trend.
And TLs which I propose here are smarter than usual TLs.
I am not a native English speaker. I might sound like kids to you. Also this is my first thread.
Sorry in advance. and just call me Zozo.
-Introduction-
This strategy is the contrarian trade with TLs made by SMA(14) on M15. I don't explain how to trade the trend follow here 'cause I think that trading trend-follow and contrarian-trade at the same time makes your brain freezed,then causes many mistaken trades,
also a contrarian trade has more chances to trade than the trend-follow trading.
There is the opportunity to trade once or twice a day in average, not only in UK,US session,also in Asian session.
I'm surely sure that this method is really simple and doesn't make the charts complicated unless you add other indicators.
-Currency: Any, but EUR/JPY and USD/CHF recommended. I explain them on this thread.
-TimeFrame: M15
*This strategy also works on other time frames but I recommend M15.
-Indicators and Download
SMA(14)
*MA method is 'Simple', also apply to 'Close'.
Daily Pivot(For traders who would like to take profit at daily pivot points)
*Do not add other indicators.
-Download
Attached File(s)
*Zip file is including experts, indicators,profiles,and templates folders.
Copy experts,profiles and templates folders and paste,overwrite into your MetaTrader 4 folders.
You can find 'Simple Trade with Smart TL' in profile folder and see the example trades of EUR/JPY, USD/CHF from 2013.06.18.
*Example trades files (chart.zip) updates once a day at least.
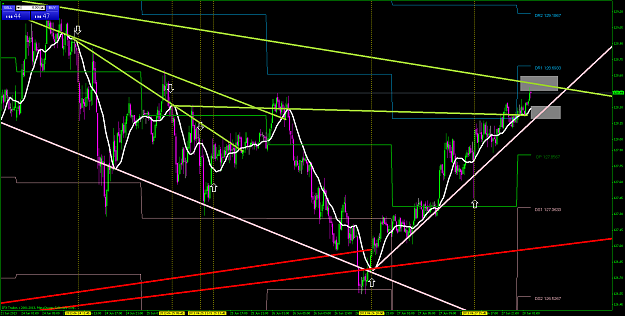
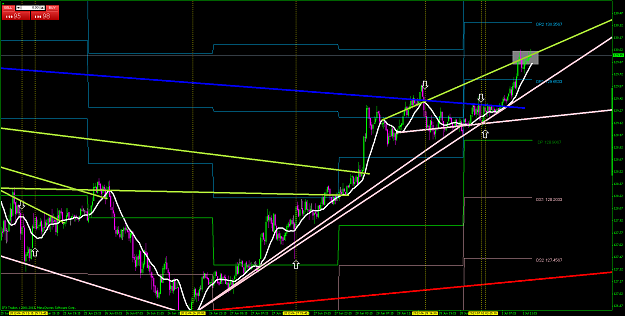
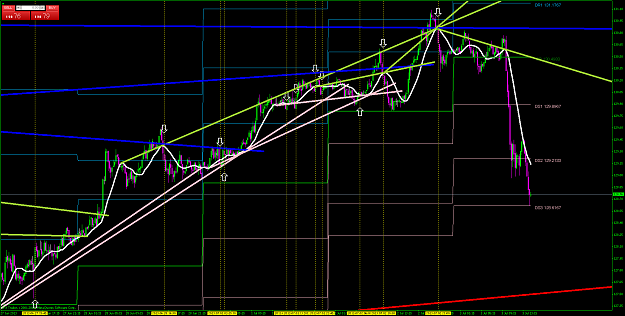
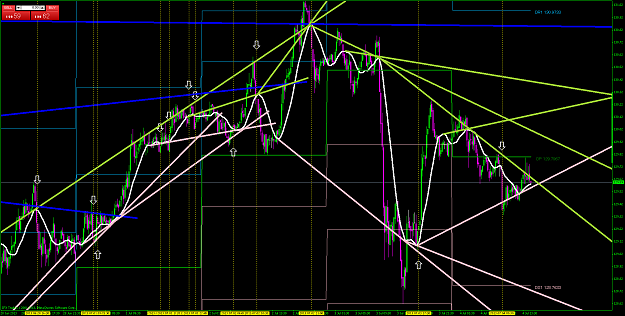
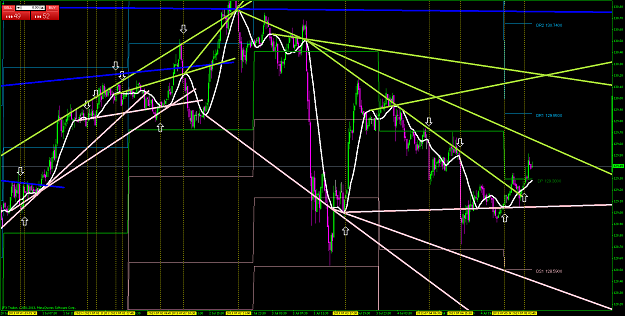
Attached Image (click to enlarge)
-How to trade
1. Draw smart TLs
2. Wait for the bounce of the TL.
1. How to draw smart TLs *important*
Draw following 4 kinds of TLs along SMA(14). Let's call them Smart TL.
(A)Blue: Outer High TL(OHTL) - Look for the last two high points(in few weeks) made by SMA(14) and tie them.
(B)Red: Outer Low TL(OLTL) - Look for the last two low points(in few weeks) made by SMA(14) and tie them.
(C)YellowGreen: Inner High TL(IHTL) - Draw high TLs in accordance with SMA(14) between OHTL and OLTL.
(D)Pink: Inner Low TL(ILTL) - Draw low TLs in accordance with SMA(14) between OHTL and OLTL.
*Those TLs can not be always drawn.
*Do not use IHTL and ILTL anymore once SMA(14) breaks them.
*You can draw a few IHTLs/ILTLs, but OHTL and OLTL should be one by one.
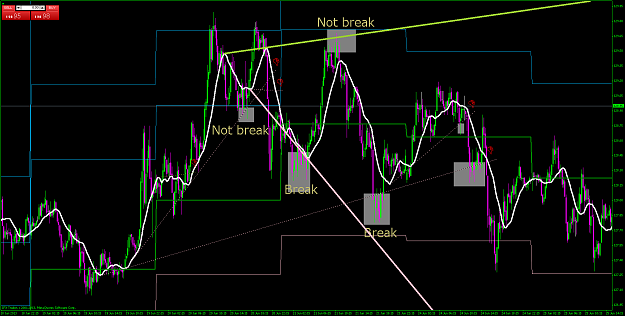
2. How to discriminate the bounce of TL, and start trading
-Buy
The price hits the OLTL/ILTL(Red/Pink) and bounces,
or the price breaks the OLTL/ILTL(Red/Pink), but SMA(14) doesn't break it,
then the price closes above SMA(14), GO BUY.
-Sell
The price hits the OHTL/IHTL(Blue/YellowGreen) and bounces,
or the price breaks the OHTL/IHTL(Blue/YellowGreen), but SMA(14) doesn't break it,
then the price closes above SMA(14), GO SELL.
-TakeProfit
Daily Pivot Points(recommended), touch other TLs, or just 20,30,40 pips as you like, it's up to you.
-BreakEven
Set 20,30,40 pips or as you like, it's up to you if you want to use BE.
-StopLoss
SMA(14) breaks one TL, or just 20,30,40 pips as you like, it's up to you.
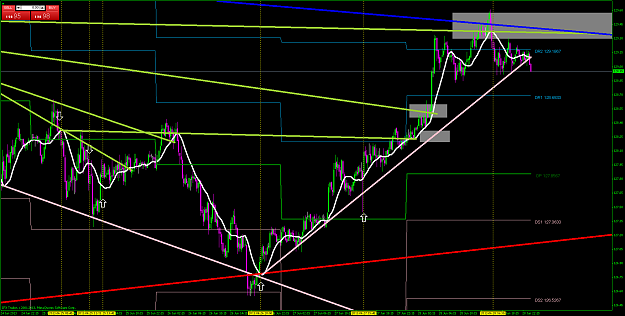
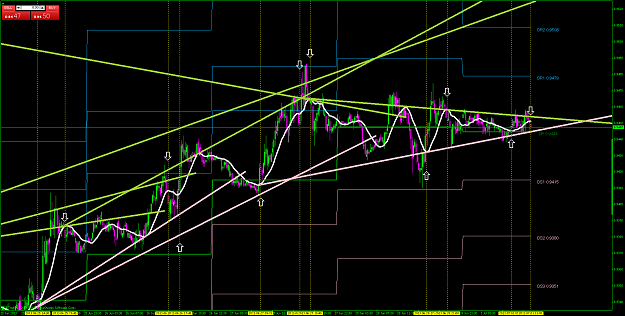
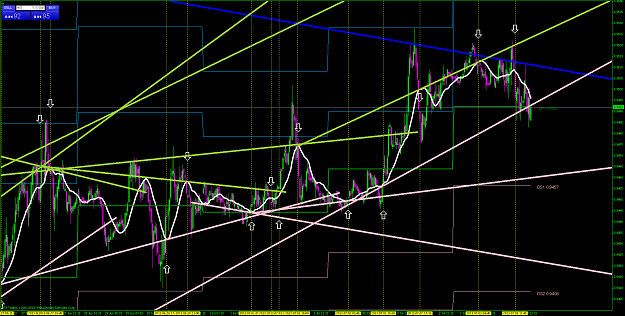
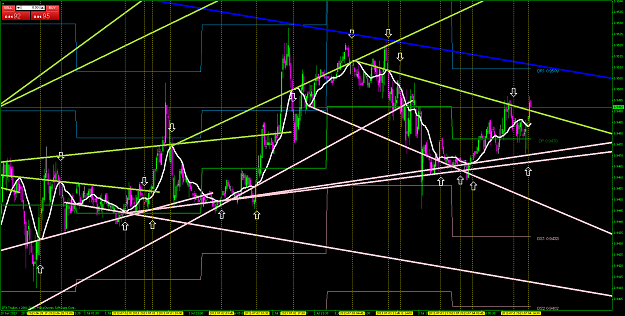
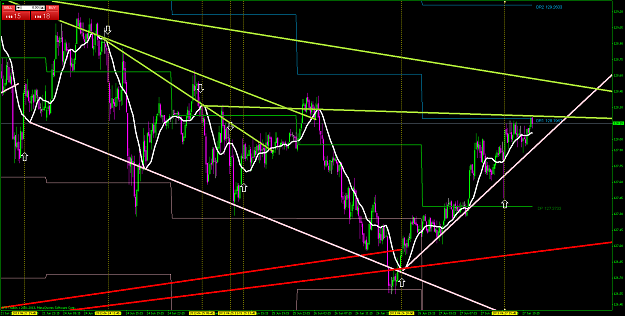
-Example trades
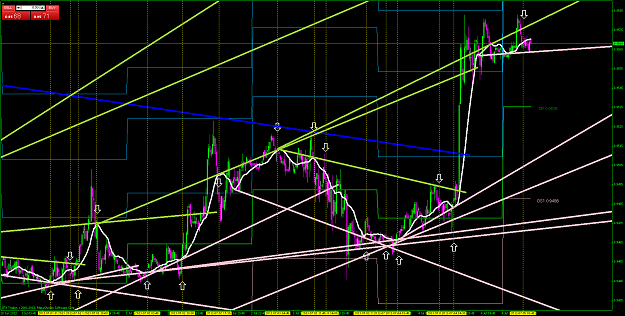
EUR/JPY
Attached Image (click to enlarge)
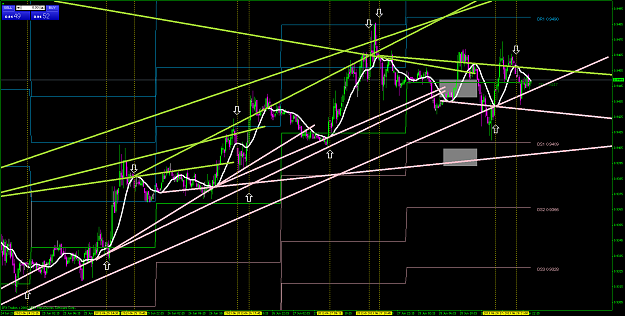
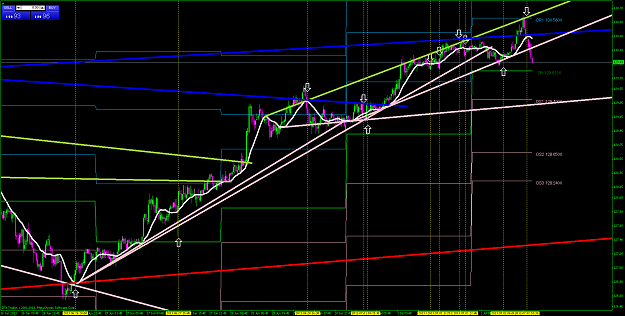
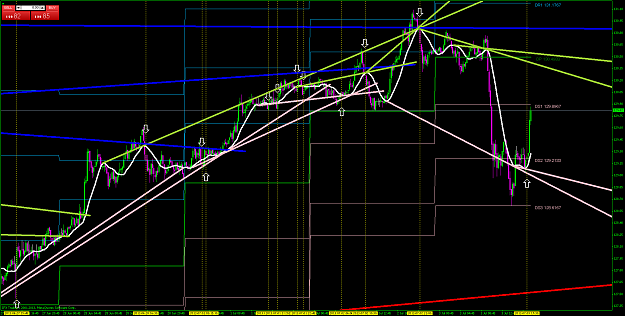
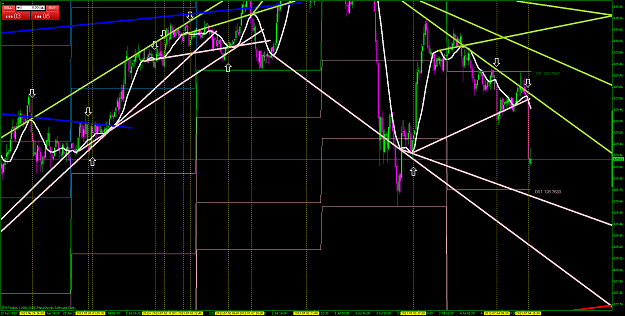
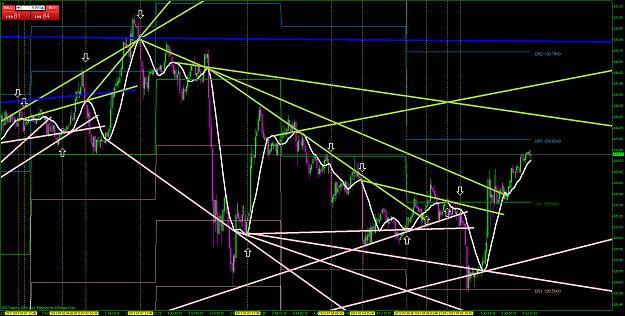
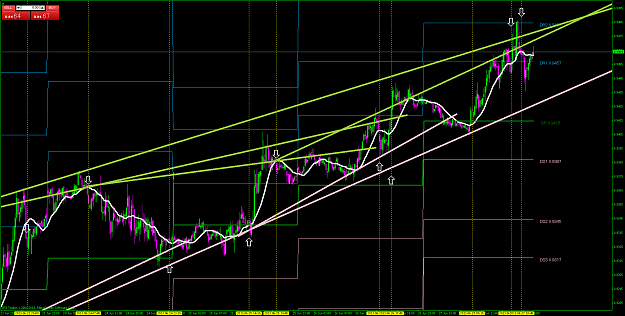
USD/CHF
Attached Image (click to enlarge)
-Caution
Do not add other indicators, or your brain might be confused. I'm showing the simple method, I don't want to make the chart complicated.
If you can not draw TLs well, that day is not the day to trade.
Just wait for the next day or try EUR/USD or GBP/USD.
My purpose here is to simply trade without any confusing ideas.
The Chart should be beautiful. Love the chart and be a chart artist!
Please remember it.
-Tips
If you can not draw IHTL/ILTL(YellowGreen/Pink), it could mean that trend would continue going up/down. So you'd better wait for the price bounce at the LTL/HTL.
Outer TLs are stronger than inner TLs.
To see the whole chart, use ZoomIn(+),ZoomOut(-),Scale fix(F8-Common-ScaleFix)
(I'll add tips when it comes to me...)
Keep calm and let's have a cool trading!!
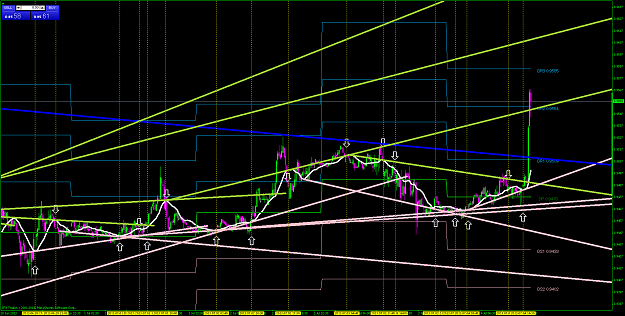
-EA
For those who don't have enough time to trade, I just made the Simple Trade with SmartTL with EA.
This EA works to start trading at TLs regardless SMA(14)
EA is from this thread. Read how to use this EA from this thread.
Put TrendLine_EA_v37.mq4 into experts folder.
Attached File(s)
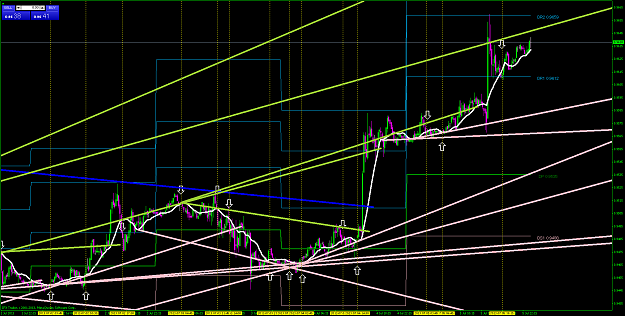
I recommend to use only BlueLine and RedLine.
template:
Buy: RedLine
Sell: BlueLine
Close: BlueLine/RedLine
TP: 0Pip
BE: 0Pip
SL: 30Pips
You can change the settings as you like.
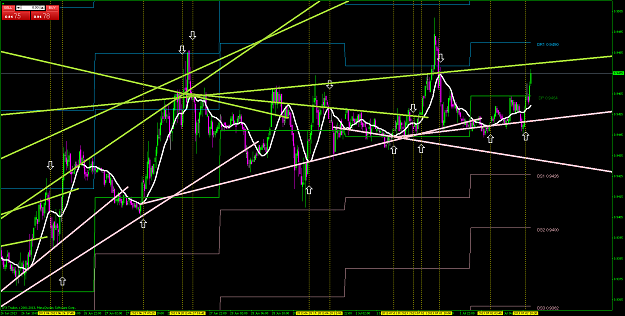
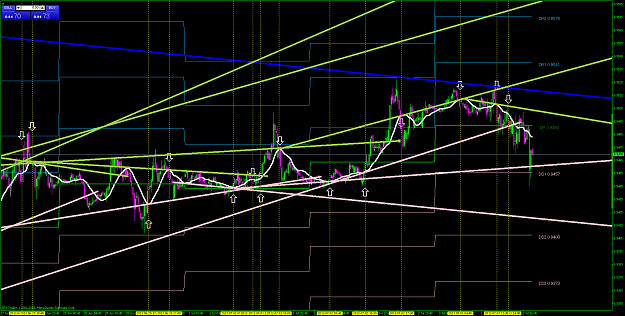
Attached Image (click to enlarge)
Attached File(s)