Markus! Have you any positions now?
Similar Threads
- Post #18,501
- Quote
- Apr 4, 2015 10:58am Apr 4, 2015 10:58am
- Joined Apr 2014 | Status: Member | 1,094 Posts
- Post #18,502
- Quote
- Apr 4, 2015 11:29am Apr 4, 2015 11:29am
- Joined Nov 2012 | Status: Member | 12,211 Posts
Disliked{quote} Hi Jan, ups, made a fault :-( Chart says: Specs have now very low short exposure. But when we look at their long exposure, it is also at record lows (around 7%) So when we again look at the COT Index, we can see, that the Specs have changed from 0 to 92,61. This would mean they are bullish. But their positioning does not fully support this case. Confusing situation. Add to that, that the sentiment index on the chart, which is a reflection of the sentiment of Specs, turned from bearish to neutral. Keep in mind: when analyzing COT data, it...Ignored
Notice that even with bad NFP, and EU climbing higher and FED postponing hikes, comms are still gripping hard by their view on EU down, this tells a lot especially considering they are important. Thats why bellow 1.1 ill stay bear, with high likely chance to see up bounce/attack near 900 or 800, and then on break only switching on bull view but not for long, maybe 100-300 pips if that happens. And lets see what comm data says then, lets say visit of 1.2 or .3 without comm switching would tell a lot. It would trigger phone call to my bank, and converting of EUR back into USD on savings.
What we can say more simplified is: dollar long train has still a lot of fuel.
- Post #18,503
- Quote
- Apr 4, 2015 11:41am Apr 4, 2015 11:41am
- Joined Jun 2010 | Status: s = k log W | 20,603 Posts
Hi Marianne,
since I am on vacation I only short term traded the last few weeks. I decided on Friday afternoon to close my EU position and simply wait for Monday to eventually get lower entries again. All in all I think we have now a descend chance in EU to go somewhat higher over the course of the next days. Would be nice if we would test the roughly 1250-1400 resistance shelf
- Post #18,504
- Quote
- Apr 4, 2015 11:52am Apr 4, 2015 11:52am
- Joined Jun 2010 | Status: s = k log W | 20,603 Posts
Disliked{quote} Yes ofcourse comm long is most important one. It makes view too confusing if you include everything you said in view basis. Best to only focous specs short and comm long for view on COT in overall. So specs are long big time, also if you notice how curve steepened lately, comms are long (hedge) for long time, so it both points that we should get lower that is overall signal of it. Interesting enough structurally i see possibility for higher add to that bad NFP, but longer term which is what more bases with COT EU structure is still bear,...Ignored
I do not know if your interpretation of the Comms is right at this time:
the Comms are very heavy long at the moment. Their COT Index is 100, and the Comm long all shows record holdings of long for this group. This is to be judged as bullish, not bearish.
When we now only look at the Daily Sentiment Index and the AnimusX data, which reflects the mood of the Specs, they have switched from very very bearish (which is bullish signal) to neutral. A bearish signal is then again given, when the Daily Sentiment Index shows very high percentage of EUR bulls again.
But we are right now in the middle of nowhere.
Since such dynamics take time, we have a fairly good chance to reach the resisstance shelf in the 1250 to 1400 area. Maybe at this point the sheeple will turn outright bullish again so that price may drop again
- Post #18,505
- Quote
- Apr 4, 2015 12:52pm Apr 4, 2015 12:52pm
- Joined Nov 2012 | Status: Member | 12,211 Posts
Disliked{quote} Hi Jan, I do not know if your interpretation of the Comms is right at this time: the Comms are very heavy long at the moment. Their COT Index is 100, and the Comm long all shows record holdings of long for this group. This is to be judged as bullish, not bearish. When we now only look at the Daily Sentiment Index and the AnimusX data, which reflects the mood of the Specs, they have switched from very very bearish (which is bullish signal) to neutral. A bearish signal is then again given, when the Daily Sentiment Index shows very high percentage...Ignored
Mate we are wrong on this one, altough you are more than myself hehe. Commercials are not hedgers as i said, obviously. But nor does it mean they being long means price to reverse lower as you said.
They are market so, when they are short price goes down. You interpreted reading from COT chart wrong. Being on upper side of scale means being short not being long:
http://prntscr.com/6phyj9
Commercials are banks, so you can clearly see banks have been shorting EURUSD a lot last year.
http://prntscr.com/6phtoi
So comms are being on "right" side, but so are specs. Interesting. Looks like one of those examples when specs are going to be right? Important info is that comms are heavy short, thus PA to go to 900 is very likely.
Btw what do i have to click on that COT site to get chart same as yours. All i get is not as much history as you and straight line on all coms and specs.
- Post #18,506
- Quote
- Edited 2:34pm Apr 4, 2015 2:10pm | Edited 2:34pm
- Joined Nov 2012 | Status: Member | 12,211 Posts
Democratic negotiations, displaying worst case scenario and at same time displaying results of agreement. How is that not fair?
http://www.zerohedge.com/news/2015-0...nker-buster-ge
All hail the truce keepers. And police nation. And non meaningfull military practices. Wait ...what?
Interesting enough Russia doesnt export its ballistic structure to Iran for nuke. Not that i would like to see world armed with nukes, but for Iran to avoid war in near future that is only option. Probably most likely becouse Iran really doesnt have nuke heads at all. Anyone has more logical explanation? World with nukes is madness, or is it, if Norad and Nato shield have hiden holes that oposition doesnt know about. Chances are low, but they are there.
If you see really whole gameplay of USA against Iran is about bombs, in regards to sanctions. Story is clear, once you have bomb, you have your freedom. Unless your balistics have no threat to oposition.
EDIT: Let me answer my own question, Russia has no interest to export balistics, becouse Iran has no range outide of 5k km of interest, with exception of USA, which is outside of range of any balistics known atm.
- Post #18,507
- Quote
- Apr 4, 2015 3:11pm Apr 4, 2015 3:11pm
- Joined Mar 2012 | Status: turning probability into profit | 1,550 Posts
DislikedDemocratic negotiations, displaying worst case scenario and at same time displaying results of agreement. How is that not fair? http://www.zerohedge.com/news/2015-0...nker-buster-ge All hail the truce keepers. And police nation. And non meaningfull military practices. Wait ...what? Interesting enough Russia doesnt export its ballistic structure to Iran for nuke. Not that i would like to see world armed with nukes, but for Iran to avoid war in near future that is only...Ignored
(fresh juce in Russian)
http://www.vestifinance.ru/articles/55569
a little bit later on the subject
Best,
D.P.
Hunting High and Low
- Post #18,508
- Quote
- Apr 4, 2015 3:39pm Apr 4, 2015 3:39pm
- Joined Nov 2012 | Status: Member | 12,211 Posts
Disliked{quote} http://www.vestifinance.ru/articles/55570 (fresh juce in Russian) http://www.vestifinance.ru/articles/55569 a little bit later on the subject Best, D.P.Ignored
- Post #18,509
- Quote
- Apr 4, 2015 3:48pm Apr 4, 2015 3:48pm
- Joined Nov 2012 | Status: Member | 12,211 Posts
Counter balistics delivered, new president can easily resign any written deal...hah seriously WHAT COULD GO WRONG FOR IRAN???
Obama you are scum. But Hillary is not even there, and she is 10 levels above it, with upgraded weapons, 2 sided witch staff, auto self block and non-term kick terms. Jeez.....we are up to a war, considering there is no way US people are not gona vote for her. Someone quote this post after elections so that its clear what it was meant to be said.
- Post #18,510
- Quote
- Apr 4, 2015 8:25pm Apr 4, 2015 8:25pm
- Joined Jun 2010 | Status: s = k log W | 20,603 Posts
Disliked{quote}Mate we are wrong on this one, altough you are more than myself hehe. Commercials are not hedgers as i said, obviously. But nor does it mean they being long means price to reverse lower as you said. They are market so, when they are short price goes down. You interpreted reading from COT chart wrong. Being on upper side of scale means being short not being long: http://prntscr.com/6phyj9 Commercials are banks, so you can clearly see banks have been shorting EURUSD a lot last year. http://prntscr.com/6phtoi...
Ignored
Seems we are talking at cross purposes LOL
Na, when Comms are record long, it does not mean price should go down, but rather price should go up.
We have the Comms, The Large (Speculators), and the Specs (smaller speculators)
Definition:
Commercials - These are the producers and end users of the commodity or futures market. However, other large traders such as swap dealers have been aggregated under this category over the last several years.
Large Traders - Also titled Large Speculators in newer reports. This group is made up of Commodity Pools, Hedge Funds, CTAs and any other entity that trades above the specified contract threshold mandated by the CFTC.
Small Speculators - Also called non-reportable in the reports because they dont have positions large enough to be required to report their positions to the CFTC.
So now when we look at the COT chart I posted, the most important part is the COT index. When a COT Index is in the upper part near 100 or at 100 it means, that the participant has increased his holdings. Being at 100 does not necessarily mean that the participants are long. They can be net short, but with reduced short position.
Since for me the Comms are the most important players (they are the true insiders), I look at the "Comms long all" value, too. It shows record net long position.
On the chart I posted, I showed the "Specs short all" position. Normally I show there "Comms long all". But it was for arguments sake.
The comms have been on the long side since the movement down started. The more EU dropped, the more they build their long position. Remember: The Comms are mainly producers who hedge.
You can look at the "%Comm long all" and additionally, as shown in the following chart, at the "Comm long all".
Attached Image (click to enlarge)
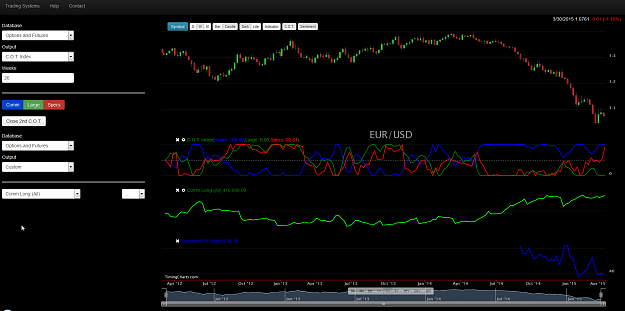
Evidence shows, that when the COT index for the Comms it at 100 and the COT index for the Large Specs is near 0, and at the same time the Comms hold record long position, it is a good idea to think about long positions.
COT data alone are not suitable as timing instrument alone.
Also important is to look at the sentiment of the Specs (or small Specs), because this group tends to be completely wrong at the turning points (meaning: they would be heavily short now, with heavy bearish sentiment, when price would be now in a reversal.
I said, that the picture is now a bit of mixed up, because sentiment of the Specs rose to neutral from very bearish (animusx and Daily Sentiment Index), and they have also lighten up a bit of their net short position, whereas the Large Specs have added to their short position
Also we have to keep in mind, that the small Specs are often right at major turning points. But their fault is then, that they tend to only hold the right direction for a very short period of time and then again going against the new established trend.
The sentiment of the small Specs is best traded via animusX-Sentiment or the Daily Sentiment Index. Few weeks ago, when we were at the very low, there were only 3% Euro bulls left. I mentioned that at the time being and went long.
Since Sentiment of the Small Specs is now in neutral area, we can not use this instrument for trading decisions. We are only interested in the extreme values.
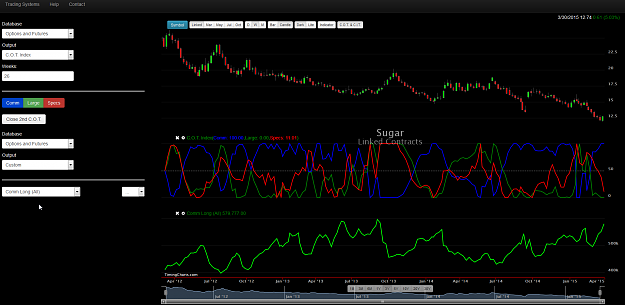
Sugar was such a nice game this week. I think I mentioned last week, that Daily Sentiment Index for Sugar was at only 6% bulls. At the same time the Comms had build record long holdings in sugar and their COT index rose to 100, whereas the COT Index of the Large Specs dropped to 0.
Look what price of sugar did this week.
Attached Image (click to enlarge)
Playing the COT data it is important to know, that the pure numbers most of the time have little meaning. It is the relative values like COT Index and %Comms long all which give sense to the data.
I strongly recommend to read Larry Williams "Trade Stock and Commodities like the insider"
- Post #18,511
- Quote
- Apr 5, 2015 4:25am Apr 5, 2015 4:25am
- Joined Nov 2012 | Status: Member | 12,211 Posts
Disliked{quote}Seems we are talking at cross purposes LOL Na, when Comms are record long, it does not mean price should go down, but rather price should go up. We have the Comms, The Large (Speculators), and the Specs (smaller speculators) Definition: Commercials - These are the producers and end users of the commodity or futures market. However, other large traders such as swap dealers have been aggregated under this category over the last several years. Large Traders - Also titled Large Speculators in newer reports. This group is made up of Commodity...
Ignored
- Post #18,512
- Quote
- Apr 5, 2015 1:26pm Apr 5, 2015 1:26pm
- Joined Mar 2012 | Status: turning probability into profit | 1,550 Posts
So the only you can do is to translate the texts by google.
Best,
D.P.
Hunting High and Low
- Post #18,513
- Quote
- Apr 5, 2015 2:33pm Apr 5, 2015 2:33pm
- Joined Nov 2009 | Status: Member | 27,245 Posts
http://www.learningmarkets.com/under...he-cot-report/
Understanding and Trading the COT Report
The COT report can provide a window into what large institutional traders are doing. This is a great way to identify the trend.
Commodity traders have access to a special market report each week that provides a snapshot of the positions of large institutional traders and small speculators in each commodity futures category. This information is called the commitment of traders report or “COT report” and is provided by the Commodity Futures Trading Commission.
Video Analysis: Behind the COT Report
The COT report is a great analytical tool for traders in any market because it provides up to date information about the trend and the strength of the commitment traders have towards that trend in each of the commodities markets. The COT report is also available on the most actively traded futures contracts such as stock indexes, interest rates and currencies..
The COT report essentially shows the net long or short positions for each available futures contract for three different types of traders. If traders are overwhelmingly long or increasing their long positions then we will have a bullish bias on that market. Similarly, if traders are short or increasing their short positions then we will have a bearish bias.
Not all traders in the report are of equal importance. In fact, of the three types of traders, investors usually pay attention to the one type with requirements most like the individual trader.
1. Commercial Traders: These traders represent companies and institutions who use the futures market to offset risk in the cash or spot market. For example, a corn producer may short corn futures contracts to protect her profits if prices fall in the near term. This class of trader is not going to be very helpful for retail investors and we don’t pay much attention to them.
2. Non-Commercial Traders: This category includes large institutional investors, hedge funds and other entities that are trading in the futures market for investment and growth. They are typically not involved directly in the production, distribution or management of the underlying commodities or assets. We pay the most attention to this category.
3. Non-Reporting Traders: This is the catch-all category for traders too small to be required to report their positions to the CFTC. We don’t know how many individual traders there are or what kind of investors they represent because they are non-reporting. Most market professionals assume that a major percentage of this category are individual speculators. They are notoriously bad traders and you will more often see this category betting against the trend than with it. We don’t pay any attention to this category.
Knowing what the big traders (non-commercials) are doing through the COT report gives us some idea about the trend for a particular asset class. We can use these reports to see what the big money is doing in just about any asset class. There are COT reports for equity investors (stock futures), commodity traders (including oil and gold) and currency traders (very important for spot FX traders.)
�
The COT reports can be used to follow traders in the forex as well as commodities and stocks.
The commitment of traders or “COT” report is useful but the raw data from the CFTC can be a little dense and confusing without some historical context. It is usually more helpful to be able to see changes within the information over time rather that just a single snapshot. Historical graphs of the COT report data can solve this problem very effectively.
Video Analysis: Behind the COT Report – Part Two
You can find and examine the report by hand each week and construct a graph yourself for the commodities you are trading. The CFTC releases the data on Fridays but the report is current as of the Tuesday before each Friday’s release. The data is available from the CFTC’s website and is prominently featured right from the home page.
If you want to track the COT data changes each week the numbers are contained within a long text file. You can see an example of what this looks like below with crude oil futures. I have highlighted a few features that I have already talked about in the last section.
1. The non-commercial traders is the column you want to examine most closely. The commercial traders to the right are mostly hedging and will often be positioned in the opposite direction of the non-commercial investors or speculators.
2. As you can see there is a mild bias towards long positions in oil among the non-commercial traders. This is technically bullish but there are warning signs on the horizon.
3. The change in long or short positions can tell us a little bit about the trend in investor sentiment. Long positions have declined since last week and short positions have increased. This seems to indicate that there is some decline in bullish sentiment.
COT Report for Crude Oil
http://d3k2o0dtpg7ker.cloudfront.net/LMO7172009cot.png
The decline in bullish sentiment has been trending like that since mid-June before this particular image was taken. You can see the market’s reaction to declining investor bullishness in the chart of crude oil below. As investor sentiment cools, traders may become more cautious about their risk exposure with tighter stops or protective options.
Daily Price Chart for Crude Oil
http://d3k2o0dtpg7ker.cloudfront.net/LMO7172009oil.png
As I mentioned above, the weekly data is useful but seeing the information within a chart to gather historical context can provide additional insight. There are several excellent, free sources for these kinds of charts on the internet. Alternatively you can compile your own version for the commodity contracts you want to see.
Besides hard commodities the COT reports from the CFTC include data for financial, currency and interest rate futures. If you are a currency trader you can find historical charts for net long or short positions and the rate of change of those traders at www.learningmarkets.com within the forex tab.
The COT report shows how committed the large institutional “non-commercial” traders are to long or short positions within each currency pair. If traders are net short, the COT graph will show a negative position and if they are net long the COT graph will show a negative position. The COT charts also illustrates the rate of change within those long or short balances.
In the video I will show you an example of the net position held by these large traders in the EUR/USD at the time it was recorded. Currency COT charts are particularly useful as they can be used to infer sentiment in related markets. For example, a falling USD/CAD is likely bullish for oil while a falling AUD/USD is probably bad for gold.
If you are interested in doing some independent research on the COT report you can get it free from the CFTC’s website at www.cftc.gov.
The COT report can be used in the same way that you might use a traditional technical indicator that only analyzes price and time. For example, we can apply filters to the report in order to understand not just whether traders are net long or short but whether they are becoming more or less bullish and bearish. That shift in investor sentiment can help predict the “flip” and can even be used to trigger a trade entry or exit.
The chart below shows the COT report graph for the AUD/USD. You can see the flip from net long to net short on 9/19/2008. That is not much of a surprise considering price action at the time. You can see what was happening on the price chart below. The black line in the COT chart shows whether traders were net long or short but the red line further analyzes this data to show the rate of change in that net short bias.
The AUD/USD COT report graph
http://d3k2o0dtpg7ker.cloudfront.net/172009LMFa.png
Weekly Chart of AUD/USD covering the same period as the COT chart above
http://d3k2o0dtpg7ker.cloudfront.net/172009LMFb.png
As you can see above, traders were net short but had been trending more towards bullishness than bearishness based on the red line which measures the rate of change of that sentiment. With this information you could assume that the underlying trend is down (based on the black line) but another flip could occur in the near term (based on the uptrending red line.) Building trading systems around this information or using it to define your own bias is relatively simple. Here are two example uses for this information.
1. Building a simple system from this information is relatively easy. For example, assume that you bought the currency pair every time the red sentiment line crossed above the mid point of the graph and reversed and shorted the currency pair when the sentiment line crossed below the mid point or neutral level of the graph. That is a simple example but could be quite effective when combined with a diversification strategy and appropriate risk management. In the video that accompanies this article Wade Hansen, one of the editors here at Learning Markets, will illustrate a system like that and what kind of returns it has delivered in the past.
2. Both the sentiment line (red) and the net long/short line (black) are important trend indicators. Short term traders may use the sentiment line to define what kind of trades they are looking for (long or short) based on the direction or trend of the red line. Longer term traders may only select trades that conform to the net long or short position of the black line. These can be an easy way to define investor sentiment and to understand the strength (or weakness) of the underlying trend.
The video in today’s article was a live presentation given by Wade Hansen in 2008. Wade developed the COT report graph including the calculations behind its sentiment line. He has tested the system in the live market and on past data and will share some of his findings in the presentation. The COT report is released each week after market close on Friday.
- Post #18,514
- Quote
- Apr 5, 2015 2:40pm Apr 5, 2015 2:40pm
- Joined Nov 2009 | Status: Member | 27,245 Posts
http://www.forextraders.com/forex-st...movements.html
Using the COT Reports to Predict Forex Price Movements
Updated: March 21, 2013 at 10:13 AM
Before examining the COT reports and a few ways of using them, let us note two important details:
Using the COT Reports to Predict Forex Price Movements
Updated: March 21, 2013 at 10:13 AM
Before examining the COT reports and a few ways of using them, let us note two important details:
- One of the major problems with the forex market is the lack of a volume indicator. Since there is no forex exchange such as the Nikkei or the NYSE, volume statistics on the entire market are not available. The COT report, tracking the currency and commodity futures allocations of the major speculators and commercial hedgers, is an excellent substitute for the volume indicator, and it should therefore be an inseparable item of any technical trading scheme.
- The other point which we would like to emphasize is the lagged nature of the report. As it updates us on positions of the past week, it is a lot more valuable as a long-term indicator, with periods of weeks, rather than days being the field of its measurements.
The COT (commitment of traders) is a report issued by CFTC to update the public on the futures positioning of traders in commodities markets. In the US most futures trading takes place in Chicago and New York, and the institutions covered by the report are heavily concentrated in these locations.
Let’s examine the body of a COT report.
EURO FX - CHICAGO MERCANTILE EXCHANGE Code-099741 FUTURES ONLY POSITIONS AS OF 03/17/09 | --------------------------------------------------------------| NONREPORTABLE NON-COMMERCIAL | COMMERCIAL | TOTAL | POSITIONS --------------------------|-----------------|-----------------|----------------- LONG | SHORT |SPREADS | LONG | SHORT | LONG | SHORT | LONG | SHORT -------------------------------------------------------------------------------- (CONTRACTS OF EUR 125,000) OPEN INTEREST: 111,077 COMMITMENTS 33,657 42,696 548 37,055 34,864 71,260 78,108 39,817 32,969 CHANGES FROM 03/10/09 (CHANGE IN OPEN INTEREST: -69,201) -273 -1,466 -1,371 -67,685 -64,551 -69,329 -67,388 128 -1,813 PERCENT OF OPEN INTEREST FOR EACH CATEGORY OF TRADERS 30.3 38.4 0.5 33.4 31.4 64.2 70.3 35.8 29.7 NUMBER OF TRADERS IN EACH CATEGORY (TOTAL TRADERS: 99) 38 30 7 19 17 60 51
Open interest describes the amount of open futures contracts that are being held. In other words, it is the total volume of open contracts in the market, but not the transactions.
Reportable positions are the positions held by institutions that meet the reporting requirement of the CFTC. These are the major players in the CBOT, and their choices are usually backed by hordes of analysts and their studies.
Non-reportable positions cover everyone who do not suit the above criteria, and they are also termed small speculators. Of reportable positions, non-commercial includes all actors who do not possess any interest in making use of the underlying currency or commodity, such as hedge funds, brokerage firms, investment banks and other related firms. Commercial open interest is created by firms that have the desire to receive or deliver the underlying. Thus the roles played by the two categories of traders is quite different.
Spreading covers those trades who hold an equal number of long-short positions on the future contracts.
The report provides data on the percentage of long or short contracts to the total, on the number of traders in all three categories with positions on a currency, and finally the changes in open interest in comparison with the previous reporting period.
Over the years the COT report has become quite a popular tool for all kinds of traders. Here are a number of ways of exploiting the data provided by the COT report.
1. Creating a currency portfolio based on the COT report positioning.
We can use the COT report data to create a diversified currency portfolio. By examining the COT report, we can have a good idea of the attitude of major traders toward the USD, but to make real use of the the data we must create a portfolio of currency pairs, such as AUD/USD, EUR/USD, USD/JPY. Since the market can be, overall, long the USD, but can be short the USD against one or more currencies, we do not want to be caught holding a pair in which the USD will lose value, while the COT is still long. Let us now suppose that the non-commercial sector is overall long the USD in our example.
What should be the criteria in deciding the currency pairs that will be included in our portfolio in such a situation? In general, it’s a good idea to make our portfolio interest-neutral, so as to express in our currency allocations our USD-positive idea, while declining to say much about the currencies we will short.
For instance, we will short AUD/USD and EUR/USD (and the carry is negative) and long USD/JPY and then we will manage our currency pair ratios in such a way that the total interest received will not exceed the Fed rate. Why do we do this? Because all we want to do is to gain from the appreciation of the USD while limiting the volatility caused by the carry trade. By making our position interest-neutral, we will, we expect, be able to ride through such disruptions. This will reduce the volatility of our portfolio, and will also reduce the potential return from our investment, but it does create a longer-lasting, more resilient position.
Another, but much riskier way to create our COT-report based portfolio would be to simply long what the commercial sector is long, and to short the commodity or currency in which the non-commercial traders are long. Thus, for instance, if the commercial sector is long the EUR, and the speculative sector is long the AUD, the trader would simply arrange his portfolio to reflect the market’s choice by assigning a large part to EUR/AUD. And one can go on with this method, to create an interest-neutral portfolio in the previously described way, thereby limiting the volatility of the position, and ensuring a more successful long-term strategy.
2. Exploiting reversals in positioning to create a portfolio
It’s also possible to arrange the above mentioned portfolios to profit from trend reversals as signaled by COT reports, but we caution against this method, unless the trader carefully hedges his position by trading uncorrelated(or negatively correlated) pairs. Correlations statistics of currency pairs are available from most major forex brokers.
It is nonetheless true that major changes in the strength of a trend, or its reversal on a permanent basis, are indeed noted by changes in open interest, and institutional positioning. Our only suggestion is that the trader be aware of the potential of false signals, and, as per the usual principle, avoid trying too hard to catch bottoms and tops.
3. Using the COT report as a long term volume indicator
An exceptionally useful and prudent use of the COT report is regarding it as a volume complement to the price studies generated by conventional technical analysis. The trader can simply refuse to act when a technical signal fails to be confirmed by a similar movement (signaled in increasing open interest) in the COT report. For an uptrend, he would expect a corresponding rise in open interest, and for a down trend, a corresponding fall. It is also possible to devise indicators for this purpose, and MACD, Williams Oscillator, or Stochastics can all be drawn on the COT report data.
This approach is akin to using volume and price data simultaneously while exploring stock market charts, and those with experience in that field will easily grasp the importance of the COT report. Nonetheless, those with little knowledge of other markets can still greatly benefit from its utilization, especially when trading on a purely technical basis.
4. Using flips in positioning to predict market reversals
In the sample COT chart above, non-commercial net positioning for Euro is short, since 38 percent of traders are holding short positions, while thirty percent hold longs. One way of exploiting this segment of the COT report is by taking note when net positioning switches from long to short and vice versa, and predicting forex market reversals on that basis. In the above example, when net positioning of the non-commercial sector switches to long, we would use the development as a signal for buying euros, coupled with some input from other sources of technical analysis.
While this method can produce results that are much more reliable than those generated by pure technical analysis, the trader should still be aware of whipsaws and unpredictable spikes and collapses that can sometimes arise. Percentage values are easier to recognize, and are easier for recognizing position flips.
5. Using extreme positioning to gauge market exhaustion
Comparing long or short positioning with historical extremes can also be beneficial in identifying market extremums. Experience shows that there are absolute values which indicate a bought-out, or sold-out currency, and as the COT positioning hits these values, there’s a significant chance of a rapid reversal.
Extremums can also be termed bubbles, as they characterize a market that is already in an unsustainable phase of rise or fall. The problem with this method lies in the fact that it’s always hard to pick up tops and bottoms: there’s no reason to expect that positioning cannot exceed a previously registered high, before collapsing. Still, if one has the determination and the resilience, extremums reported by the COT report have much greater value than that reported by price based technical analysis.
It is possible to confirm the absolute extremes on the COT report with extremes on moving averages or oscillators on the price chart.
Summary
The COT report is a very useful tool which can be substituted for the volume indicators of stocks analysis. Absolute long and short positioning and historical comparisons can be useful for identifying market extremes. Percentage changes in open interest can be valuable in noting position flips and predicting market reversals in the medium term. If there ever were an ultimate technical indicator, its seekers have their greatest luck in COT data. But the old advice on not putting all eggs in the same basket is still valid: it’s better to confirm signals from the COT report with data from other aspects of technical analysis, and of course fundamental analysis, before reaching decisions.
- Post #18,515
- Quote
- Apr 5, 2015 2:40pm Apr 5, 2015 2:40pm
- Joined Jun 2010 | Status: s = k log W | 20,603 Posts
Disliked{quote} I strongly recommend to read Larry Williams "Trade Stock and Commodities like the insider"Ignored
http://www.traders-software.com/Free...0COT%20Report/
- Post #18,516
- Quote
- Apr 5, 2015 2:43pm Apr 5, 2015 2:43pm
- Joined Nov 2009 | Status: Member | 27,245 Posts
Long Term - COT Report
Most short-term traders or speculators trade FX based on technical analysis, so equity and futures traders who use technical analysis have made the switch to FX fairly easily. However, one type of analysis that traders have not been able to transfer over to currencies is volume-based trading.
Since the currency market is decentralized and there is no one exchange that tracks all trading activities, it is difficult to quantify volume traded at each price level. But in place of volume-based trading, many traders have turned to the Commodity Futures Trading Commission's Commitments of Traders (COT) report, which details positioning on the futures market, for more information on positioning and volume. Here we look at how historical trends of the COT report can help FX traders. (Find out how to gauge the psychological state of a currency market in Gauging Major Turns With Psychology.)
What Is the COT Report?
The Commitments of Traders report was first published by the CFTC in 1962 for 13 agricultural commodities to inform the public about the current conditions in futures market operations (you can find the report on the CFTC website here). The data was originally released just once a month, but moved to once every week in 2000. Along with reporting more often, the COT report has become more extensive and - luckily for FX traders - it has also expanded to include information on foreign currency futures. If used wisely, the COT data can be a pretty strong gauge of price action. The caveat here is that examining the data can be tricky, and the data release is delayed as the numbers are published every Friday for the previous Tuesday's contracts, so the information comes out three business days after the actual transactions take place.
Reading the COT Report
Figure 1 is a sample euro FX weekly COT report for June 7, 2005, published by the CFTC. Here is a quick list of some of the items appearing in the report and what they mean:
- Commercial - Describes an entity involved in the production, processing, or merchandising of a commodity, using futures contracts primarily for hedging
- Long Report - Includes all of the information on the "short report", along with the concentration of positions held by the largest traders
- Open Interest - The total number of futures or options contracts not yet offset by a transaction, by delivery or exercise
- Noncommercial (Speculators) - Traders, such as individual traders, hedge funds and large institutions, who use futures market for speculative purposes and meet the reportable requirements set forth by the CFTC
- Nonreportable Positions - Long and short open-interest positions that don't meet reportable requirements set forth by the CFTC
- Number of Traders - The total number of traders who are required to report positions to the CFTC
- Reportable Positions - The futures and option positions that are held above specific reporting levels set by CFTC regulations
- Short Report - Shows open interest separately by reportable and non-reportable positions
- Spreading - Measures the extent to which a non-commercial trader holds equal long and short futures positions
http://i.investopedia.com/inv/articl...TReport1_R.gif
Figure 1
Taking a look at the sample report, we see that open interest on Tuesday June 7, 2005, was 193,707 contracts, an increase of 3,213 contracts from the previous week. Noncommercial traders or speculators were long 22,939 contracts and short 40,710 contracts, making them net short. Commercial traders, on the other hand, were net long, with 19,936 more long contracts than short contracts (125,244 - 105,308). The change in open interest was primarily caused by an increase in commercial positions as noncommercials or speculators reduced their net-short positions.
Using the COT Report
In using the COT report, commercial positioning is less relevant than noncommercial positioning because the majority of commercial currency trading is done in the spot currency market, so any commercial futures positions are highly unlikely to provide an accurate representation of real market positioning. Noncommercial data, on the other hand, is more reliable because it captures traders' positions in a specific market. There are three primary premises on which to base trading with the COT data:
- Flips in market positioning may be accurate trending indicators.
- Extreme positioning in the currency futures market has historically been accurate in identifying important market reversals.
- Changes in open interest can be used to determine strength of trend.
Flips in Market Positioning
Before looking at the chart shown in Figure 2, we should mention that in the futures market all foreign currency exchange futures use the U.S. dollar as the base currency. For Figure 2, this means that net-short open interest in the futures market for Swiss francs (CHF) shows bullish sentiment for USD/CHF. In other words, the futures market for CHF represents futures for CHF/USD, on which long and short positions will be the exact opposite of long and short positions on USD/CHF. For this reason, the axis on the left shows negative numbers above the center line and positive numbers below it.
The chart below shows that trends of noncommercial futures traders tend to follow the trends very well for CHF. In fact, a study by the Federal Reserve shows that using open interest in CHF futures will allow the trader to correctly guess the direction of USD/CHF 73% of the time.
http://i.investopedia.com/inv/articl...TReport2_R.gif
Figure 2: Net positions of noncommercial traders in the futures for Swiss francs (corresponding axis is on the left-hand side) on the International Monetary Market (IMM) and price action of USD/CHF from April 2003 to May 2005 (corresponding axis is on the right-hand side). Each bar represents one week.
Source: DailyFX
Flips - where net noncommercial open-interest positions cross the zero line - offer a particularly good way to use COT data for Swiss futures. Keeping important notation conventions in mind (that is, knowing which currency in a pair is the base currency), we see that when net futures positions flip above the line, price action tends to climb and vice versa.
In Figure 2, we see that noncommercial traders flip from net long to net short Swiss francs (and long dollars) in June 2003, coinciding with a break higher in USD/CHF. The next flip occurs in September 2003, when noncommercial traders become net long once again. Using only this data, we could have potentially traded a 700-pip gain in four months (the buy at 1.31 and the sell at 1.38). On the chart we continue to see various buy and sell signals, represented by points at which green (buy) and red (sell) arrows cross the price line.
Even though this strategy of relying on flips clearly works well for USD/CHF, the flip may not be a perfect indicator for all currency pairs. Each currency pair has different characteristics, especially the high-yielding ones, which rarely see flips since most positioning tends to be net long for extended periods as speculators take interest-earning positions.
Extreme Positioning
Extreme positioning in the currency futures market has historically also been accurate in identifying important market reversals. As indicated in Figure 3 below, abnormally large positions in futures for GBP/USD by noncommercial traders has coincided with tops in price action. (In this example, the left axis of the chart is reversed compared to Figure 2 because the GBP is the base currency.) The reason why these extreme positions are applicable is that they are points at which there are so many speculators weighted in one direction that there is no one left to buy or sell. In the cases of extreme positions illustrated by Figure 3, every one who wants to be long is already long. As a result, exhaustion ensues and prices begin reversing.
http://i.investopedia.com/inv/articl...Report3_Ra.gif
Figure 3: Net noncommercial positions in GBP futures on IMM (corresponding axis is on the left-hand side) and price action of GBP/USD (corresponding axis is on the right-hand side) from May 2004 to April 2005. Each bar represents one week.
Source: DailyFX
Changes in Open Interest
Open interest is a secondary trading tool that can be used to understand the price behavior of a particular market. The data is most useful for position traders and investors as they try to capitalize on a longer-term trend. Open interest can basically be used to gauge the overall health of a specific futures market; that is, rising and falling open interest levels help to measure the strength or weakness of a particular price trend. (To learn more, read Gauging Forex Market Sentiment With Open Interest.)
For example, if a market has been in a long-lasting uptrend or downtrend with increasing levels of open interest, a leveling off or decrease in open interest can be a red flag, signaling that the trend may be nearing its end. Rising open interest generally indicates that the strength of the trend is increasing because new money or aggressive buyers are entering into the market. Declining open interest indicates that money is leaving the market and that the recent trend is running out of momentum. Trends accompanied by declining open interest and volume become suspect. Rising prices and falling open interest signals the recent trend may be nearing its end as fewer traders are participating in the rally.
The chart in Figure 4 displays open interest in the EUR/USD and price action. Notice that market trends tend to be confirmed when total open interest is on the rise. In early May 2004, we see that price action starts moving higher, and overall open interest is also on the rise. However, once open interest dipped in a later week, we saw the rally topped out. The same sort of scenario was seen in late November and early December 2004, when the EUR/USD rallied significantly on rising open interest, but once open interest leveled off and then fell, the EUR/USD began to sell off.
http://i.investopedia.com/inv/articl...TReport4_R.gif
Figure 4: Open interest in the EUR/USD (corresponding axis is on the left-hand side) and price action (corresponding axis on right-hand side) from January 2004 to May 2005. Each bar represents one week.
Source: DailyFX
Summary
One of the drawbacks of the FX spot market is the lack of volume data. To compensate for this, many traders have turned to the futures market to gauge positioning. Every week, the CFTC publishes a Commitment of Traders report, detailing commercial and non-commercial positioning. Based on empirical analysis, there are three different ways that futures positioning can be used to forecast price trends in the foreign-exchange spot market: flips in positioning, extreme levels and changes in open interest. It is important to keep in mind, however, that techniques using these premises work better for some currencies than for others.
Read more: http://www.investopedia.com/walkthro...#ixzz3WShAo1qP
Follow us: @Investopedia on Twitter
- Post #18,517
- Quote
- Apr 5, 2015 2:46pm Apr 5, 2015 2:46pm
- Joined Nov 2009 | Status: Member | 27,245 Posts
http://www.crbtrader.com/ebooks/pdf/...l%20Trends.pdf
Learn to Analyze the New COT Report like a Pro
For Futures, Options and FOREX traders!
By Gary Kamen
TRENDS
What lies beneath
ALL trends?
*.pdf.
Learn to Analyze the New COT Report like a Pro
For Futures, Options and FOREX traders!
By Gary Kamen
TRENDS
What lies beneath
ALL trends?
*.pdf.
- Post #18,518
- Quote
- Apr 5, 2015 2:49pm Apr 5, 2015 2:49pm
- Joined Nov 2009 | Status: Member | 27,245 Posts
http://www.moneyshow.com/articles.as...currency-25991
Trading Forex Using the COT Report
Published: 01/02/2012 6:00 am EST
By: Staff at DailyFX.com
Trading Forex Using the COT Report
Published: 01/02/2012 6:00 am EST
By: Staff at DailyFX.com
http://graphics.moneyshow.com/keywords/FOREX_10.jpg
The Commitment of Traders (COT) report is not a market timing tool, but remains a valuable indicator forex traders can use to measure sentiment and spot potential short-term changes in market trends.
The Commodity Futures Trading Commission (CFTC) Commitment of Traders (COT) report offers a unique look at the positioning of futures traders across a broad range of markets, and it is quite often used as a proxy for the FX trading market. In the weekly report, the US regulator breaks down long and short positions and overall open interest according to three separate trading groups.
Such a breakdown makes it unique from other positioning measures, and understanding the behavior of the three groups is essential in using the indicator as a tool in trading.
Commercial Traders: These are most often large, multinational corporations with commercial hedging interest in their respective futures markets. For example, a large Japanese manufacturer may want to hedge their exposure to fluctuations in the US dollar/Japanese yen exchange rate.
Non-Commercial Traders: These are most often large speculators such as Commodity Trading Advisors (CTAs) and similarly large institutions speculating in specific futures markets. For example, a major commodity fund believes that the US dollar will appreciate against the euro, and as such, it places bets on euro FX futures.
Non-Reportable Traders: These are traders who don’t fall into either group. Most often seen as small speculators, these are arguably less significant and do not frequently figure into COT report analysis.
http://graphics.moneyshow.com/trader...currency02.gif
Click to Enlarge
With these general definitions in mind, we can then decide exactly how we might choose to use this information.
How to Trade Using COT Data
Given that Commitment of Traders data is released only once per week and on a delayed basis, it is difficult to use it as a market timing tool. This does not rule it out as a trading indicator, but it is important to keep this caveat in mind.
As such, we most often use COT information as an indicator to identify broader trends and potential reversals—not exact times for trading.
As a Trend Confirmation Tool
Given that non-commercial traders are most often large speculators, we expect them to generally move in favor of the major trend. Thus, we watch for when these traders move in one direction to any significant degree and look to position ourselves accordingly.
http://graphics.moneyshow.com/trader...rrency02-2.gif
Click to Enlarge
The green line in the chart above plots net non-commercial positioning. That is to say the number of contracts long minus those that are short, giving us a metric for sentiment and positioning in the GBP/USD currency pair.
Positioning flipped net short the British pound against the US dollar when the GBP/USD traded above the 2.00 level. Though timing trend shifts is extremely tricky, we saw the pair consolidate before a pick-up in short interest pointed firmly to the downside. Indeed, traders have broadly remained net short the GBP until fairly recently, keeping it confined within an extended downtrend.
- Post #18,519
- Quote
- Apr 5, 2015 2:50pm Apr 5, 2015 2:50pm
- Joined Nov 2009 | Status: Member | 27,245 Posts
http://www.babypips.com/school/under...rs-report.html
Commitment of Traders Report
The COT Report: What, Where, When, Why, and How
The Commodity Futures Trading Commission, or CFTC, publishes the Commitment of Traders report (COT) every Friday, around 2:30 pm EST.
Because the COT measures the net long and short positions taken by speculative traders and commercial traders, it is a great resource to gauge how heavily these market players are positioned in the market.
http://www.babypips.com/images/schoo...et-players.png
Later on, well let you meet these market players. These are the hedgers, large speculators, and retail traders. Just like players in a team sport, each group has its unique characteristics and roles. By watching the behavior of these players, youll be able to foresee incoming changes in market sentiment.
Youre probably asking yourself, Why the heck do I need to use data from the FX futures market?
Doesnt the spot forex market have a report that measures how currency traders are positioned?
Im a spot forex trader! Activity in the futures market doesnt involve me.
Remember, since spot forex is traded over-the-counter (OTC), transactions do not pass through a centralized exchange like the Chicago Mercantile Exchange.
So whats the closest thing we can get our hands on to see the state of the market and how the big players are moving their money?
Yep, you got it
The Commitment of Traders report from the futures market.
Before going into using the Commitment of Traders report in your trading strategy, you have to first know WHERE to go to get the COT report and HOW to read it.
Previous Lesson Mark Lesson Complete Next Lesson
Save your progress by signing in and marking the lesson complete!
- Forex Market Sentiment
- Commitment of Traders Report
- How to Find the COT Report
- Understanding the COT Report
- How to Use the COT Report for Trading
- How to Pick Tops and Bottoms With the COT Report
- How to Create Your Own COT Trading Indicator
- How to Interpret the COT Report
- Summary: Market Sentiment
Read more: http://www.babypips.com/school/under...#ixzz3WSiuhvml
- Post #18,520
- Quote
- Apr 5, 2015 2:52pm Apr 5, 2015 2:52pm
- Joined Nov 2009 | Status: Member | 27,245 Posts
http://www.barchart.com/futures/cot.php
The Commitments of Traders (COT) Reports
The Commitments of Traders (COT) Reports