Disliked{quote} I never thought that it looks like a radarBut yes , it does , I just noticed. I am just a student of Kambooj , I have been following his posts about circular trendlines for long while , and finally developped my own way of using them. So they are just Fibo Arcs in a circular form. 1,618 really works in an amazing way. Its an irreplacable tool for me. Still not holy grail ... but its really fun to decode the secret trends of the market and to witness they move in ratio (not always). I check some threads regularly here on ff , and this...
Ignored
Hi Selym,
in fact, at the moment, I use the tick-volume as proxy for real volume. There are some studies out, that can be found in this thread, that show, that the tick-volume has a correlation of over 90% with real volume. (normally, that should be good enough most of the time, especially when you do trade the somewhat bigger swings).
For this I use the data of FXCM, which may be at the moment the most active brokerage.
A better idea is to use the real volume data Dukascopy provides out of their SWFX liquidity pool. This volume data can be easily accessed through their Historical quotes link:
http://www.dukascopy.com/swiss/engli...ch/historical/
But this data are delayed by one day. I have to figure out a way to get the streaming data into my Excel spreadsheets or whatsoever.
So right now the FXCM data I get via Metatrader are far more convenient to me, since all is transferred automatically into my Excel spreadsheets.
If you need help to set this up give me a mail :-)
You can go another way completely via Metatrader. Search for a Market Profile indicator which can calculate the VPO instead of the TPO. This indicator must be capable of allowing you to determine the start and end of the calculation time-span.
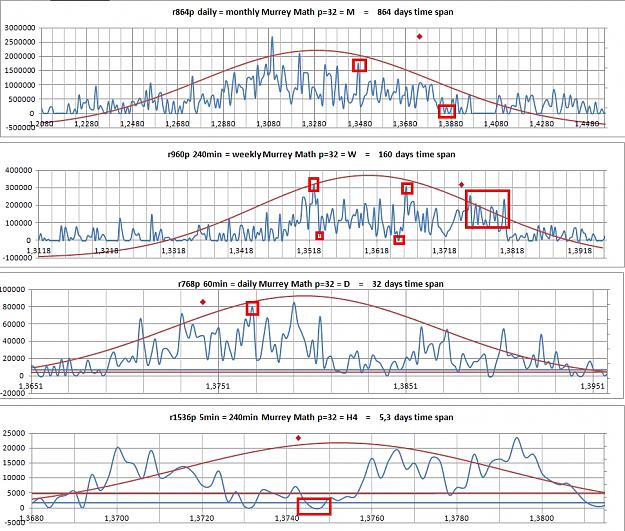
For Murrey Math reasons I work on all TF's with a lookback period of 32 periods