momentum is down, could very well be a down day.....
Ignored
Maybe. But the way it started was bullish. It normally makes three attempts to capture a level and 1.3550 is a good one. I can hit several sls in a row. Let's see what happens.
{quote} Maybe. But the way it started was bullish. It normally makes three attempts to capture a level and 1.3550 is a good one. I can hit several sls in a row. Let's see what happens.
Ignored
It went below a very strong fib line which is at 1.3518. Chances are it will bounce down from 1.3513 or so. But earlier there was good buying at and just below 1.3509. I am taking this chance for good r:r
{quote} Maybe. But the way it started was bullish. It normally makes three attempts to capture a level and 1.3550 is a good one. I can hit several sls in a row. Let's see what happens.
Ignored
the completed 4h candle could give more informations, specially if it closes at his low. However, she is in range and now at the bottom of it, bulls might push this to the other end....which is the top of a bullish flag(4h)...yes...let see..
{quote} It went below a very strong fib line which is at 1.3518. Chances are it will bounce down from 1.3513 or so. But earlier there was good buying at and just below 1.3509. I am taking this chance for good r:r
{quote} the completed 4h candle could give more informations, specially if it closes at his low. However, she is in range and now at the bottom of it, bulls might push this to the other end....which is the top of a bullish flag(4h)...yes...let see..
Ignored
very much a range bar, got out of my short with a few green pips.....
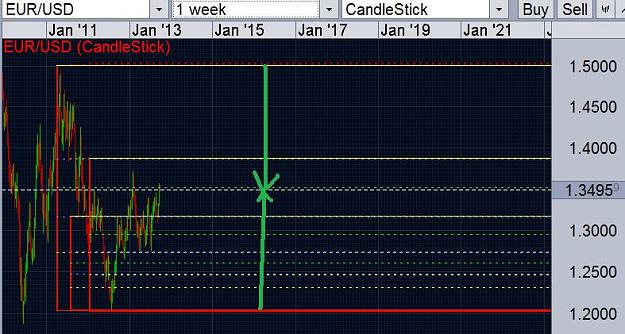
1. Take weekly chart and draw fib from top to bottom
2. Mark 50%
3. See in which part current pa is, ie., upper or lower
4. Draw a fib for that 50% portion where pa is
5. Mark 50% of 50%
6. Repeat step 3 above
7. Keep on doing this until you get nearest to current pa
Focus on these levels and see if any of these are broken. Once broken, wait for the pa to retrace and confirm the broken level. There will be some movement above and below that, Mark the extreme point that proved support or resistance on retrace. This now becomes mark for your sl. Add 2 or 3 pips to that as safety cushion and set your sl there.
Joined Sep 2008
|
Status: Married - 5 Wives
|14,713 Posts
Getting stopped out sometimes with profit sometimes with loss. Still betting on bulls because pa has not retraced very much, indicating it may make another attempt at 1.3550.
Currently long with sl of 11 pips. Will close 50% if 22 in plus. That will be around 1.3515.
{quote} 1. Take weekly chart and draw fib from top to bottom 2. Mark 50% 3. See in which part current pa is, ie., upper or lower 4. Draw a fib for that 50% portion where pa is 5. Mark 50% of 50% 6. Repeat step 3 above 7. Keep on doing this until you get nearest to current pa Focus on these levels and see if any of these are broken. Once broken, wait for the pa to retrace and confirm the broken level. There will be some movement above and below that, Mark the extreme point that proved support or resistance on retrace. This now becomes mark for your...
Ignored
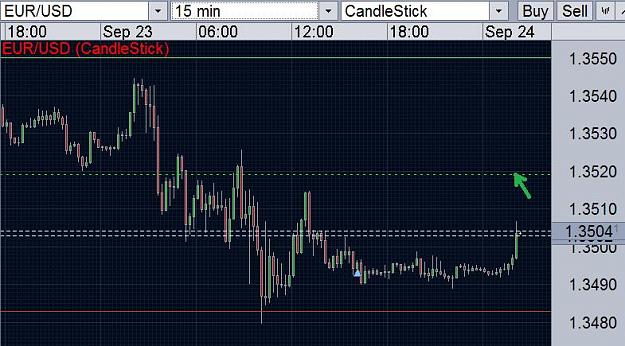
This is the 15M close-up of above weekly chart. The two arrows meet at long-term 50% fib at 1.3518. We are very close to this 50% fib. I am sure it makes a lot sense to consider this a very important level. Let's see if pa goes above this level to touch 1.3550.
{quote} This is the 15M close-up of above weekly chart. The two arrows meet at long-term 50% fib at 1.3518. We are very close to this 50% fib. I am sure it makes a lot sense to consider this a very important level. Let's see if pa goes above this level to touch 1.3550. {image}
Ignored
Once you draw these lines, never ever remove them from your chart. You will be surprised to see how pa follows these levels months and years after you have drawn.Some people use colored lines to mark strength of these levels, 50% fibs from bigger trends are more strong. I use green dotted lines for every 50% fib. If one level denotes more than one fib is considered stronger. However, I mostly rely on 50% fib, not really the 50% fib, but retrace level nearest to a 50% fib. Logically market should not move based on whatever technicals we use. Actual levels are more important, but you will find them near our technicals ........ why is that? I simply don't know.
{quote} 1. Take weekly chart and draw fib from top to bottom 2. Mark 50% 3. See in which part current pa is, ie., upper or lower 4. Draw a fib for that 50% portion where pa is 5. Mark 50% of 50% 6. Repeat step 3 above 7. Keep on doing this until you get nearest to current pa Focus on these levels and see if any of these are broken. Once broken, wait for the pa to retrace and confirm the broken level. There will be some movement above and below that, Mark the extreme point that proved support or resistance on retrace. This now becomes mark for your...
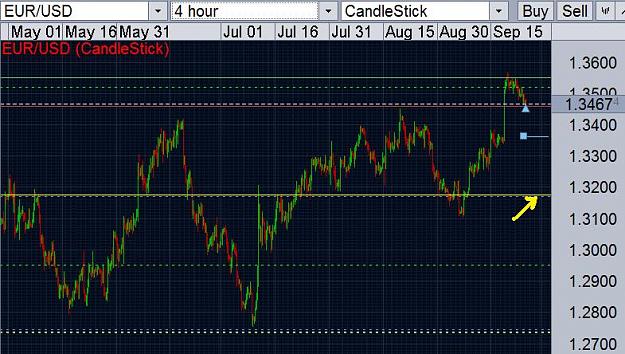
The distance between 1.3518 and 1.3452 is 66 pips. 1.3518 - 33 = 1.3485 1.3485 - 16.5 = 1.34685 1.3485 - 16.5 = 1.3452 These are the important levels for now. I went long just before 1.3468 targeting 1.3485 but was stopped out.
Ignored
1.3452 is an important number, but daily chart is yelling 1.3400. This is only reason I am taking long trades, because if it has to go to 1.3400, may make another attempt at 1.3550.
1.3500 is a very important level, it has penetrated this level and therefore a couple of more attempts are due. Sometime pa retraces and goes back rmore than 150 to 200 pips to later break such levels. I will be looking at longs.
{quote} 1.3452 is an important number, but daily chart is yelling 1.3400. This is only reason I am taking long trades, because if it has to go to 1.3400, may make another attempt at 1.3550. 1.3500 is a very important level, it has penetrated this level and therefore a couple of more attempts are due. Sometime pa retraces and goes back rmore than 150 to 200 pips to later break such levels. I will be looking at longs.
Ignored
The next fib I have is at 1.3174 (the yellow dotted line)
Getting stopped out sometimes with profit sometimes with loss. Still betting on bulls because pa has not retraced very much, indicating it may make another attempt at 1.3550. Currently long with sl of 11 pips. Will close 50% if 22 in plus. That will be around 1.3515.
Ignored
Missed that 50% close, when got back to computer, it was too late. It went down like a bullet after touching 1.3518 or so. That was big blow to my account. It was a well calculated trade, aiming to close 50% just before 1.3518. What you can do? This is how it is.
{quote} This is the 15M close-up of above weekly chart. The two arrows meet at long-term 50% fib at 1.3518. We are very close to this 50% fib. I am sure it makes a lot sense to consider this a very important level. Let's see if pa goes above this level to touch 1.3550. {image}
{quote} Once you draw these lines, never ever remove them from your chart. You will be surprised to see how pa follows these levels months and years after you have drawn.Some people use colored lines to mark strength of these levels, 50% fibs from bigger trends are more strong. I use green dotted lines for every 50% fib. If one level denotes more than one fib is considered stronger. However, I mostly rely on 50% fib, not really the 50% fib, but retrace level nearest to a 50% fib. Logically market should not move based on whatever technicals we use....
Joined Sep 2008
|
Status: Married - 5 Wives
|14,713 Posts
It didn't touch 1.3452. This is a major concern.
when it returns halfway normally goes a long way but eventually comes back to claim left pips.
I am long but with tight stops
It didn't touch 1.3452. This is a major concern. when it returns halfway normally goes a long way but eventually comes back to claim left pips. I am long but with tight stops
Ignored
Taking chance on long as it has not retraced much since FOMC .
What I do not understand is this: You say never to delete those lines, but once the prices move in a "different area", one has to draw the 50% to the actual price, would that not change the overall structure of the 50% that it has been drawn down from the weekly chart? or do you just delete the most recent one after prices moved to the recent "different area"? Thank you.