{quote} Hallo CNTrader, What is the best TimeFrame for using with Harmonic patterns ? Do we need Ninja, or we can use MT4 ? Thank you in advance
Ignored
Hello Elen, let me officially welcome you to the thread. To briefly answer your question: Harmonic patterns occur on all Time frames. I like larger time frames when volatility is low and when I wanna see the big picture and I like all time frames when volatility is high or I wanna make bank scalping 8-60 pips. You need to figure what works best for you and your style of making bank. The charts I post are MT4 charts but Ninja works very nicely as well. Good luck with your journey and don't forget to:
Enjoy, have fun, trade your plan, make a great day, do your own due diligence and may we all make bank!!
Don't follow me! You can and most likely will LOSE all your money!!!!
{quote} You are welcome. I do not use any indicators, so can not help you there. I believe you are better off without them anyway imo.
Ignored
Thanks Bro well said. Couldn't have said it better. Agree 100%. I would only add that having an indicator draw them for you is no where near as much fun! But thats just the analysis junkie in me talking. lol
Enjoy, have fun, trade your plan, make a great day, do your own due diligence and may we all make bank!!
Don't follow me! You can and most likely will LOSE all your money!!!!
{quote} NO!!!!!! lol but I do believe there is another thread on FF that does and occasionally a few people do post charts that are using them. Enjoy, have fun, trade your plan, make a great day, do your own due diligence and may we all make bank!!
Ignored
Thanks for the response. What about the measurements and ratios? Do you use the crosshair tool to measure distances between points or how do you do it? I find the way the measurements are presented to be quite confusing since the easiest way, in my opinion, would be to use fib retracement.
{quote} Thanks for the response. What about the measurements and ratios? Do you use the crosshair tool to measure distances between points or how do you do it? I find the way the measurements are presented to be quite confusing since the easiest way, in my opinion, would be to use fib retracement. Thank you.
Ummmmmm....what He said! Any other questions please refer to the first few posts or read the thread and watch some of the vids posted. Good luck with your journey and remember.......
Enjoy, have fun, trade your plan, make a great day, do your own due diligence and may we all make bank!!
Don't follow me! You can and most likely will LOSE all your money!!!!
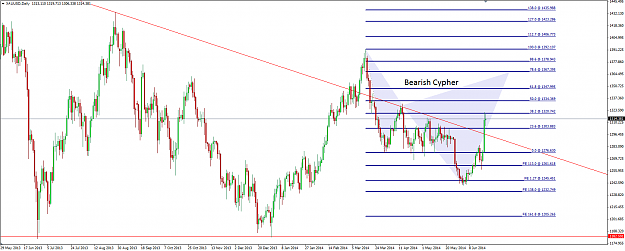
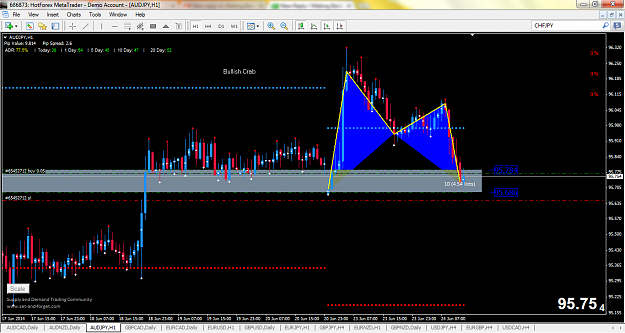
{quote} Aud/Jpy update: Hey Traders currently involved with the Aggressive C sell zone and watching for these other developments as well {image} Enjoy, have fun, trade your plan, make a great day, do your own due diligence and may we all make bank!!
Ignored
Attached Image (click to enlarge)
The world you desire can be won. It exists.. it is real.. it is possible..
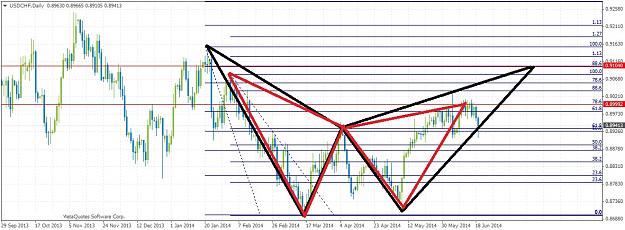
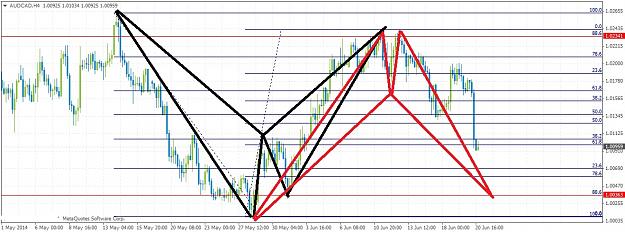
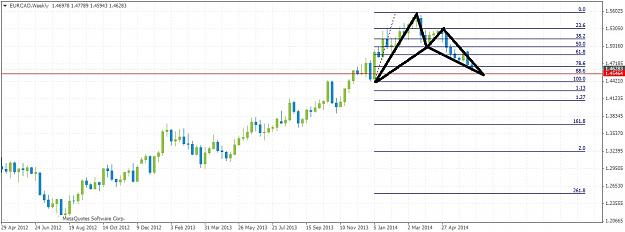
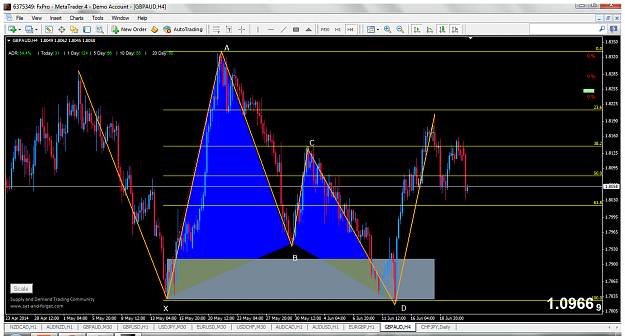
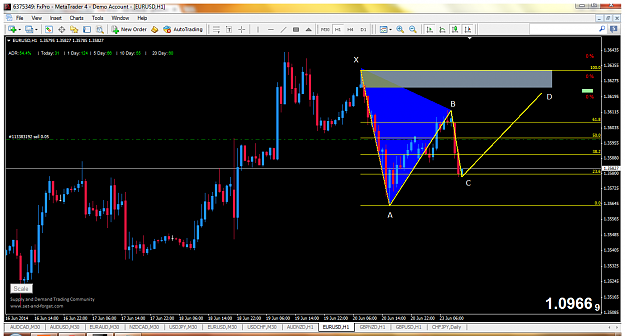
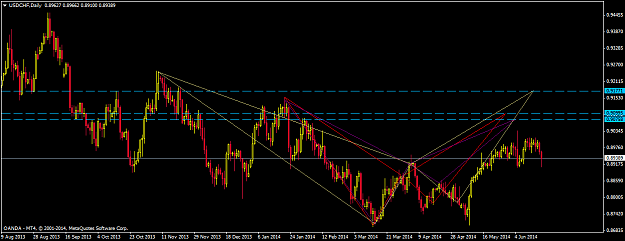
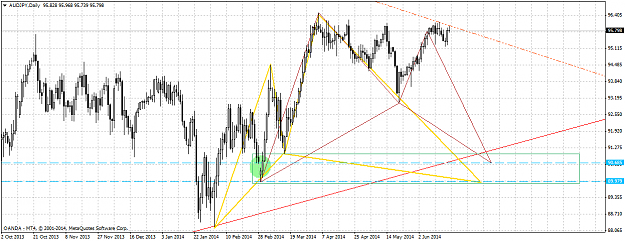
Some harmonics for you. Enjoy the weekend. {image} {image} {image}
Ignored
Hi Mr. S,
do you simply use one Fib Retracement to find harmonic patterns or do you check every single wave for its retracement amount?
For example, a gartley, do you just draw one fib retracement from point X to A then after it bounces from point B at 61.8, as long as it does not invalidate X to A, you will look at 78.6 as the end point?
Or do you measure every wave, X to A then A to B (making sure its 38.2 - 88.6) then finally check and make sure that the 78.6 of X to A matches 1.13 - 1.618 of B to C to find D?
{quote} Hi Mr. S, do you simply use one Fib Retracement to find harmonic patterns or do you check every single wave for its retracement amount? For example, a gartley, do you just draw one fib retracement from point X to A then after it bounces from point B at 61.8, as long as it does not invalidate X to A, you will look at 78.6 as the end point? Or do you measure every wave, X to A then A to B (making sure its 38.2 - 88.6) then finally check and make sure that the 78.6 of X to A matches 1.13 - 1.618 of B to C to find D? Not sure if you understand...
Ignored
Hi Aeternum,
Not sure I do understand exactly, but I will say that the patterns are obvious to me. Then, I pull the fibs on the swings and look for confluence. Then, if I have time, I draw pretty pictures and post them here at FF.
Does that help?
Good job on gold, keep looking it has been fun of late.
The world you desire can be won. It exists.. it is real.. it is possible..
{quote} Hi Aeternum, Not sure I do understand exactly, but I will say that the patterns are obvious to me. Then, I pull the fibs on the swings and look for confluence. Then, if I have time, I draw pretty pictures and post them here at FF. Does that help? Good job on gold, keep looking it has been fun of late.
Ignored
Well, what I meant was, the screenshot I have of Gold is done using only 1 Fib retracement for X-A. Would you draw fib retracement for A-B and B-C as well? Meaning instead of 1 set of fib lines, there would be 3?
{quote} Well, what I meant was, the screenshot I have of Gold is done using only 1 Fib retracement for X-A. Would you draw fib retracement for A-B and B-C as well? Meaning instead of 1 set of fib lines, there would be 3?
Ignored
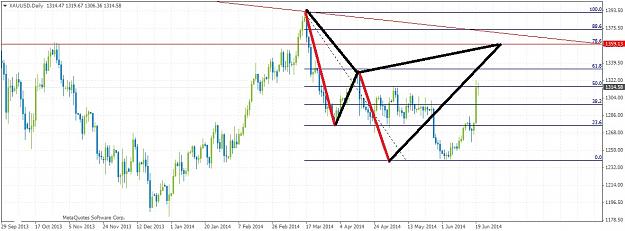
hmmmm..well yes. Should check structure and relationships. Best I can say is people will have different rules e.g. BC projection. I posted a gold chart for my friend on another thread a few days ago, because like I mentioned there are quite a few here. But I will post one I have in case it is helpful.
Attached Image (click to enlarge)
The world you desire can be won. It exists.. it is real.. it is possible..
{quote} hmmmm..well yes. Should check structure and relationships. Best I can say is people will have different rules e.g. BC projection. I posted a gold chart for my friend on another thread a few days ago, because like I mentioned there are quite a few here. But I will post one I have in case it is helpful. {image}
Ignored
Seems like you drew this from a few fib plots. Looks good with previous resistance too
{quote} i didn't see it as bullish butterfly ( blue area ), check the ratio for buttefly. but i see bullish dragon to form bearish shark/chyper in your chart
Ignored
Thanks for the response, really helpful because I hadn't given much thought to sharks. Being new to this, my focus was on the Gartley, Butterfly and Bat.