{quote} I know exactly what you are saying. During off hours price and volume dont correlate together because there isnt enough market makers to impact price movement i isn either direction. To add volume becomes a factor IMO between 12am EST to 1 pm EST. This is when Japan, Europe, UK and US markets are active. I have been trading with volume for over a year now and have fined tuned my trading for a 6 hour wind between 8am EST to 1 EST but this can be adjust Im in MST so thats actually 6am to 11am. Also depends on the news etc, such a FED minutes...
Ignored
Having correlation would be sweet. This delta volume indicator definitely does deviate a lot from price. I'll have to pay more attention to it during NY open to see if it correlates better. One thing I have observed is that price seems to sometimes move with little resistance (on little volume), and at other times with great resistance (large volume). Those large volume candles might look like lots of buying or selling going on, but because brokers are showing us mostly retail trader volume, there may be a lot if institutional absorption going on. With the premise that I want to take the path of least resistance, I'll also be looking at fading those larger volume candles if with the trend.
{quote} Having correlation would be sweet. This delta volume indicator definitely does deviate a lot from price. I'll have to pay more attention to it during NY open to see if it correlates better. One thing I have observed is that price seems to sometimes move with little resistance (on little volume), and at other times with great resistance (large volume). Those large volume candles might look like lots of buying or selling going on, but because brokers are showing us mostly retail trader volume, there may be a lot if institutional absorption...
Ignored
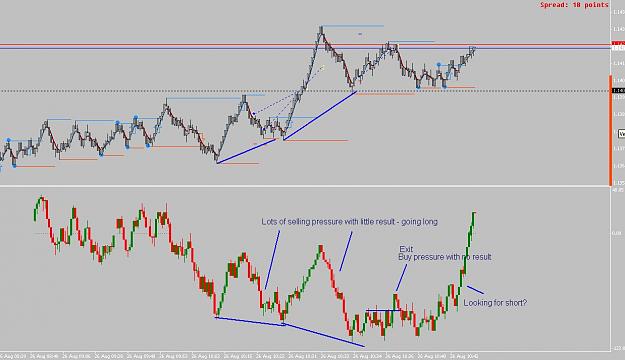
I fooled around a bit with this idea this AM.Trying to "follow the path of least resistance...fading those areas where volume has trouble moving the market, and going in the direction that when price moves easily with less volume. Worked out well enough. it was fun, but felt a bit like gambling :-). After I took this screenshot, I went short twice. One a winner and on a loser...
This seems to have potential. Not a big fan of indicators, but this one has my interest. Thanks guys. {image} {image} {image}
Ignored
It looks like you are looking at a way to incorporate volume into your existing method. Very smart, because I'm not so sure that volume alone is enough!
Currently I'm working on a history version. First, I'm trying to record every tick (bid and ask) in a file. This results in a 350 kb file after about 4 hrs, so maybe not the best way to store long time frames, but since I like to trade different types of charts (range, constant volume, renko), its the only way to get the data to convert accurately. The alternate way would be to record only the open,close, high, low. But then the data would be limited to only the timeframe recorded.
Just want to add, that fibos can be something that really helps out with the correlation of volume to price. It seems when price is within a range of correlation to volume the divergence and convergence measures can be used to look for reversals with a higher probability of this. But when price and volume move outside of a range 50% for example. The diver/conver signals dont seem to work as well and the price is going to continue the trend.
Just think of it this, as price moves up but volumes moves down it shows that lots of sellers are closing there positions and at the big players are taking big positions, as the range moves further away from correlation it shows the strength in the trend.
This of course ties in with key ZONES, as well as channel breaks with re-touch bounces.
Learn, a forex trader must, unlearn and relearn he will.
Hey Sciurus That history idea, sounds pretty awesome. Just want to add, that fibos can be something that really helps out with the correlation of volume to price. It seems when price is within a range of correlation to volume the divergence and convergence measures can be used to look for reversals with a higher probability of this. But when price and volume move outside of a range 50% for example. The diver/conver signals dont seem to work as well and the price is going to continue the trend. Just think of it this, as price moves up but volumes...
Ignored
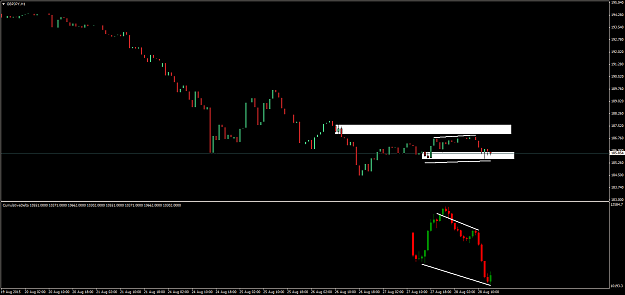
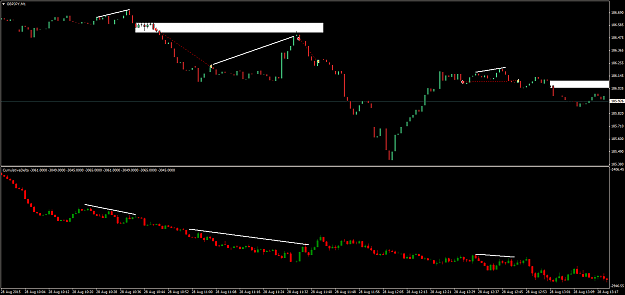
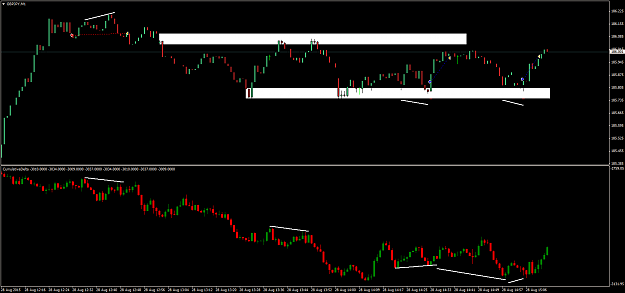
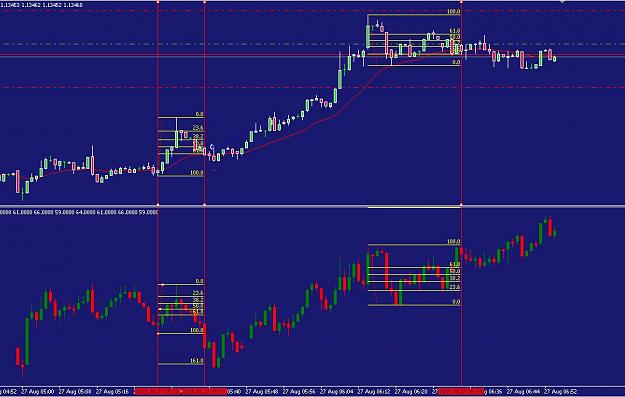
Succinctly put. I know exactly what you mean. Here is a screenshot from yesterday with fibs plotted on price AND volume in areas where price and volume diverged (price was at 50% retrace, and volume at 100% retrace). Sandwiched between them is where price and volume were in sync, and price trended upwards. But then there are those areas where price is at 100% retrace, and volume is at 150-200%.
{quote} Succinctly put. I know exactly what you mean. Here is a screenshot from yesterday with fibs plotted on price AND volume in areas where price and volume diverged (price was at 50% retrace, and volume at 100% retrace). Sandwiched between them is where price and volume were in sync, and price trended upwards. But then there are those areas where price is at 100% retrace, and volume is at 150-200%.{image}
Ignored
OMG LMAO you know exactly what Im talking about, this is very exiting.
those both are prime examples, very nice.
Both Delta and Cumulative are hidden gems IMO as can be seen.
Learn, a forex trader must, unlearn and relearn he will.
Ok folks. Here is an updated version of Delta volume.
Key changes.
-Will now show history (but you need to first gather some data by enabling it in the settings).
-automatic background colour detection.
-can change bar colour in settings.
One problem remains, and that is that it cannot handle multiple charts accessing the same history file. Hence DO NOT apply to multiple charts with the same symbol unless history is disabled. Or else, your terminal will freeze. I am not liable for what happens if you do not heed this warning.
I am also attaching two example history files. Tick data goes in the files folder, and will appear there automatically if you enable tick recording.
Change the symbol name in the filename to whatever your broker uses (so in one example below the broker uses EURUSDcsfx as the symbol).
Cheers.
PS, I am extremely interested in seeing the volume feed from other brokers, so please post some of your own history files if you get the chance.
Ok folks. Here is an updated version of Delta volume. Key changes. -Will now show history (but you need to first gather some data by enabling it in the settings). -automatic background colour detection. -can change bar colour in settings. One problem remains, and that is that it cannot handle multiple charts accessing the same history file. Hence DO NOT apply to multiple charts with the same symbol unless history is disabled. Or else, your terminal will freeze. I am not liable for what happens if you do not heed this warning. I am also attaching...
Ignored
Awesome work buddy!
Understanding liquidity, Time Action and Price Action is priceless!
Ok folks. Here is an updated version of Delta volume. Key changes. -Will now show history (but you need to first gather some data by enabling it in the settings). -automatic background colour detection. -can change bar colour in settings. One problem remains, and that is that it cannot handle multiple charts accessing the same history file. Hence DO NOT apply to multiple charts with the same symbol unless history is disabled. Or else, your terminal will freeze. I am not liable for what happens if you do not heed this warning. I am also attaching...
Ignored
Hey your an awesome guy for going above and beyond doing this.
Noob question, when you say place the history file in the file folder........what file folder do you mean ?
Learn, a forex trader must, unlearn and relearn he will.
{quote} Hey your an awesome guy for going above and beyond doing this. Noob question, when you say place the history file in the file folder........what file folder do you mean ?
Ignored
It would go in the 'Files' folder. Program folder --> mql --> Files --> tick data file
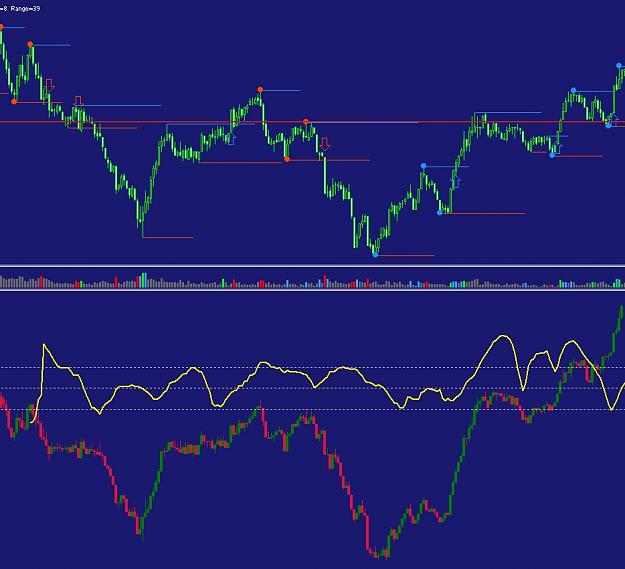
Without getting too ahead of myself (), here is the 20 period Pearson's product moment correlation between delta volume and price. with the limited amount of data I have, it seems to cycle between 0 and 50% correlation. I'm not sure how useful, but it is interesting. As I was doing this, it occurred to me that a decent way to measure correlation would be to compare the slope of MAs on both price and volume.
Without getting too ahead of myself (), here is the 20 period Pearson's product moment correlation between delta volume and price. with the limited amount of data I have, it seems to cycle between 0 and 50% correlation. I'm not sure how useful, but it is interesting. As I was doing this, it occurred to me that a decent way to measure correlation would be to compare the slope of MAs on both price and volume. {image}
Ignored
Hey Sciurus,
Note that it introduces a lag of period/2. You may want to consider shifting the correlation line 10 bars into the past and then checking the behaviour.
k
Ok folks. Here is an updated version of Delta volume. Key changes. -Will now show history (but you need to first gather some data by enabling it in the settings). -automatic background colour detection. -can change bar colour in settings. One problem remains, and that is that it cannot handle multiple charts accessing the same history file. Hence DO NOT apply to multiple charts with the same symbol unless history is disabled. Or else, your terminal will freeze. I am not liable for what happens if you do not heed this warning. I am also attaching...
Ignored
Thanks for sharing Sciurus
I'm having issues with it on one of my MT4s though.. it works on the others, but on one particular it never creates the "tick file" when I select "recordTicks"..
Allow DLL Imports is checked off on the Expert Advisor Tab in Chart Properties, and also checked off on the common tab in the Indicator Settings.. not sure why a CSV file isn't being created.. though this broker has a "." suffix on all pairs and not sure if that is the issue?
{quote} Thanks for sharing Sciurus I'm having issues with it on one of my MT4s though.. it works on the others, but on one particular it never creates the "tick file" when I select "recordTicks".. Allow DLL Imports is checked off on the Expert Advisor Tab in Chart Properties, and also checked off on the common tab in the Indicator Settings.. not sure why a CSV file isn't being created.. though this broker has a "." suffix on all pairs and not sure if that is the issue? Thanks
Ignored
Strange. Is 'allow dll imports' selected when you apply the indicator (it needs to be to handle the background colour stuff). Also, what a strange broker suffix! I'm going with the ell imports being the problem. Try the newest version (attached), allow dlls, and see if that works. I also added some simple code so that if it can't create or open the file for that step it will print a message in the Experts tab to that effect.
[quote=kprsa;8464152]{quote}Hey Sciurus,
Note that it introduces a lag of period/2. You may want to consider shifting the correlation line 10 bars into the past and then checking the behaviour.
k
/quote]
Good point Krpsa! My hope though was to be able to read the very latest information flowing into the market, so maybe Pearson's isn't the way to do it. Although it may still give some info about levels to be visited in the future? Right now, it might actually be easier to visually assess the correlation, especially at those important levels!
{quote} Strange. Is 'allow dll imports' selected when you apply the indicator (it needs to be to handle the background colour stuff). Also, what a strange broker suffix! I'm going with the ell imports being the problem. Try the newest version (attached), allow dlls, and see if that works. I also added some simple code so that if it can't create or open the file for that step it will print a message in the Experts tab to that effect. {file}
Ignored
Thanks for your help, but it still doesn't work
DLL imports was checked off (selected), I made sure it was before I posted my initial reply too.
There's still no csv file being created, and the expert tab is not reporting that no file is being created either, which is really weird..
For the record, it's a Darwinex MT4 that is not cooperating.. if anyone else wants to try and report back?
If not, don't worry about it and thanks again for your help.. still works great on my other MT4s