Hi Diavolul, when the two pivot indicator is removed from a chart, it doesn't delete DATA1 and DATA2 objects. Is it an oversight or intentional? Thanks, Karel
Ignored
You have to remove the objects, manually. What do you think about the whole visualisation of the areas outside and between the two major pivot levels? thank you
OK, it's just that all the other objects are removed automatically.
Quote
Disliked
{quote} What do you think about the whole visualisation of the areas outside and between the two major pivot levels? thank you
I have just scanned the whole thread (so I haven't thought about it all that much as yet) but at he moment I don't see much difference in price action between the 'neutral box' and the other two but I like the three boxes arrangement as a visual aid and as an inducement to to think a bit more about quality of the pivots.
I also like the style of your an analysis and I plan to go thriough the thread in more detail (as soon as I get some free time!) and so maybe will also see the neutral box in different light
Hopefully I'll have more comments/questions later.
Thank you for your reply. {quote} OK, it's just that all the other objects are removed automatically. {quote} I have just scanned the whole thread (so I haven't thought about it all that much as yet) but at he moment I don't see much difference in price action between the 'neutral box' and the other two but I like the three boxes arrangement as a visual aid and as an inducement to to think a bit more about quality of the pivots. I also like the style of your an analysis and I plan to go thriough the thread in more detail (as soon as I get some free...
Ignored
I use to draw the s/r lines (pivot levels) to more significantly levels I can see, that's why on some charts you might see a zoom out perspective. Because, sometimes, the price is so choppy and so meaningless that I have trouble to draw even the two pivot levels. It happened on EUR/CHF pair and few others.
It took me almost 3 years to learn, on a trial and error basis, how to put the things in a making sense strategy with the whole s/r lines as pivot levels, confirmation zones, and stop-loss placement so...
If you have any preference for analysis feel free to submit it in the poll at the start of the topic or in a private message and I will analyze it as soon as I can.
Joined May 2010
|
Status: Full time trader
|729 Posts
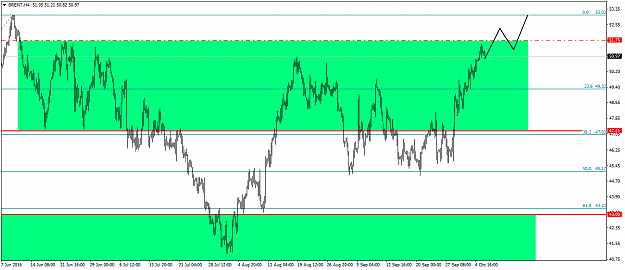
Commodities: BRENT, medium-term analysis.
Brent is very close for a for considering a long entry, the explanation of the entry being included in the fact that the bias on this commodity is on the upside area (the price is situated over the 47.21 pivot level), - all we need now is a close of the 4h time frame candlestick over the 51.75 level for confirmation of the upside bias, for targeting the previous relevant high - 53.03 level, as a soft target.
Joined May 2010
|
Status: Full time trader
|729 Posts
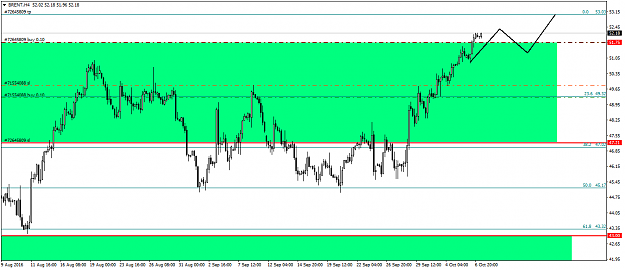
Commodities: BRENT, medium term analysis
Brent has confirmed its presence into the upside bias by closing over the confirmation level of 51.75, as I've talked about in the last intervention. The first target should be 53.03 and then further more to the upside. I would have placed it further but I've already entered into a long position so I'm playing carefully regarding the risk exposure in these very volatile times (GBP related pairs had crashed last night). The S/L is placed on the pivot level that delimitates the upside from the neutral area - 47.21.
Joined May 2010
|
Status: Full time trader
|729 Posts
Forex: USD/JPY, short term analysis
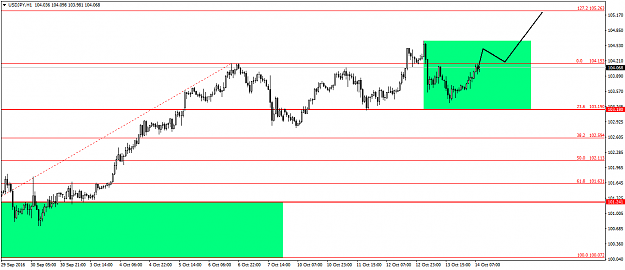
After hitting the previous high 104.63, almost whole setup must be modified, excepting the target. So the nearest pivot level will be 103.18 while the target will be 105.263 (127.2 Fibonacci of the upside movement 100.072-104.153). A safest approach is to enter either on a close over 104.63 or with a pending on it with a stop-loss on the 103.18 pivot level. A market position would be kind of risky and the lot size should be dramatically decreased (70% less).
Joined May 2010
|
Status: Full time trader
|729 Posts
Commodities: XAU/USD (Gold), medium term analysis
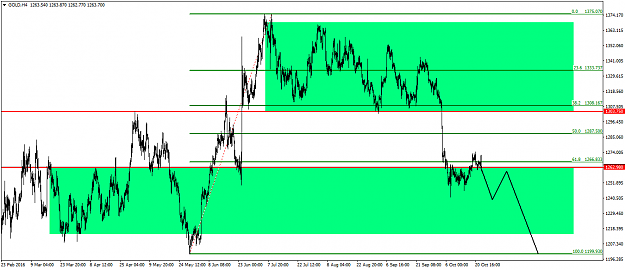
Since 6th October 2016, the Gold has fluctuated below and above the 1262.98 medium term pivot level for multiple times. Today barely has stayed under it - being in neutral bias. If goes once again under the 1262.98 level it bias will change once again for a tentative to attack 1214.48 level, on which downside closing will confirm a sell entry toward 1199.93. Over the 1303.75 the price will change its bias into the upside after more than a month.
Joined May 2010
|
Status: Full time trader
|729 Posts
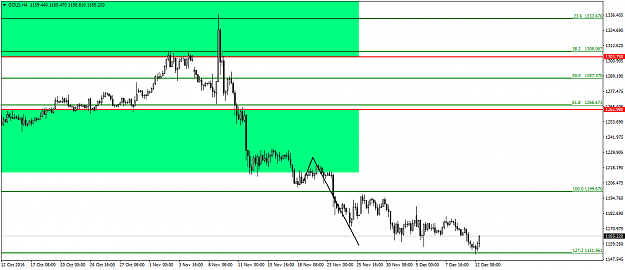
Commodities: XAU/USD (Gold), medium term analysis
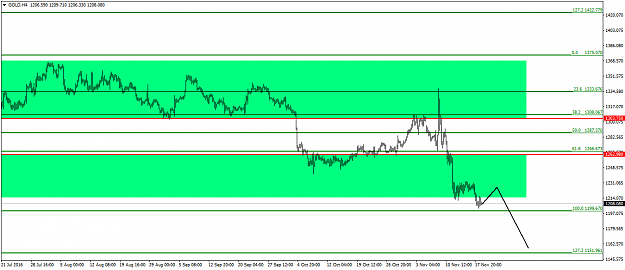
Just recently, the gold has entered into the downside area by closing under the 1262.98 level. Not only that but has also closed below the lower level of confirmation area, under the 1214.34 level. From current level, the price should go lower towards 1199.67 level and even lower - 1151.96 (127.2 Fibonacci level of the upside move 1199.67-1375.07), having the stop-loss on the nearest pivot level - 1262.98
Joined May 2010
|
Status: Full time trader
|729 Posts
Forex: USD/JPY, short term analysis
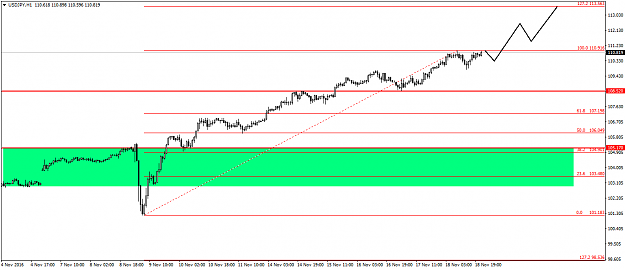
The price of this currency pair is overvalued for quite of time, the bias remains into the upside bias, having the price over the 108.52 pivot level. As an entry, we could go long targeting 113.56 (127.2 Fibonacci level of the 103.48-110.91 move) and stop-loss on nearest pivot level - 108.52.
Joined May 2010
|
Status: Full time trader
|729 Posts
European Equities: CAC40, long term analysis
The French index is situated between the two pivot levels: 4602.5 and 4269.8 - the bias is in the neutral state because of that. It is unclear now where will it go, will wait either to cross the 4602.5 into the upside bias and wait for the confirmation zone to be invalidated or to go below the 4269.8 and wait for the downside bias confirmation zone to be invalidated. Until then, no trading.
Joined May 2010
|
Status: Full time trader
|729 Posts
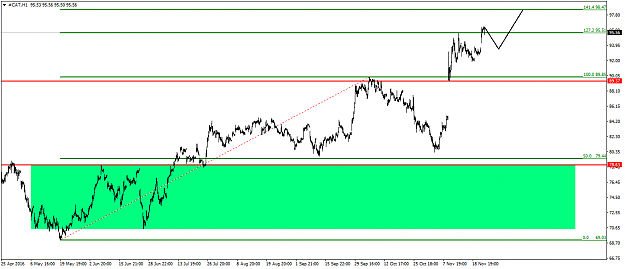
US equities: #CAT (Caterpillar Inc.), medium term analysis
The price remains into the upside bias (it is situated over the 89.37 pivot level) and will, possibly, continue its initial upside move towards 98.47 (141.4 Fibonacci extension of the upside move of 69.03-89.85). A suitable stop-loss/exit of long position would be on 89.37 pivot level if the price doesn't hit the target.
{quote} I follow this thread diligently with the hope of personal improvement. The pair hit the 113.89 today which is beyond the take profit 113.56. Nice trading technique.
Ignored
Thank you for your kind words. Glad to hear that. If you have any question related to this strategy, I will happily answer it. It was designed for trading in a more simple manner, doesn't require any market terms whatsoever.
Forex: USD/JPY, short term analysis The price of this currency pair is overvalued for quite of time, the bias remains into the upside bias, having the price over the 108.52 pivot level. As an entry, we could go long targeting 113.56 (127.2 Fibonacci level of the 103.48-110.91 move) and stop-loss on nearest pivot level - 108.52. {image}
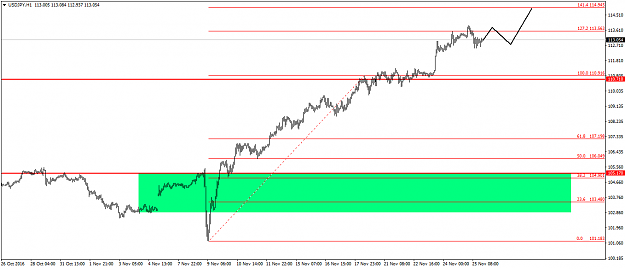
Forex: USD/JPY, medium term analysis (quick update)
The buy should continue towards 114.945 (141.4 Fibonacci extension of the upside move 101.183-110.71), the only thing that has modified is the nearest pivot level which is situated now on 110.71 and where the stop-loss should be placed.
{quote} Thanks for giving out such a wonderful strategy. I have understood how this can be used to detect the prevailing trend. I understand your profit projection and stop loss placement.My struggle is how to determine the right entry price.Please, can you briefly explain how to determine where to buy when we are in a clear uptrend using your strategy? Thanks once again for your efforts.
Ignored
If you mean that how I can just entry another position, like on the USD/JPY case from the previous post (on a continuing trend), either you are entering after your last target is hit (127.2 or another target) and simply enter to another long targeting another level: 141.4 or 161.8 or you have a pending buy just 2-3 pips above your previous target (to cover the spread on the currency pair) or either just put a pending limit to gain some more pips, but what to do is to modify the pivot lines if necessary, when if the left of the chart your previous pivot lines have no sense anymore (like I did with the upper one in the previous post).
And in the rest of the cases you just wait for a close 1) above/bellow the pivot line and 2) above/bellow the upper/lower level of the confirmation zones.
Hopefully, I have reached your expectation with the answer. If not, please reply.
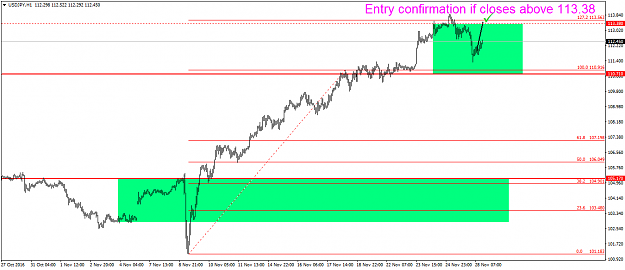
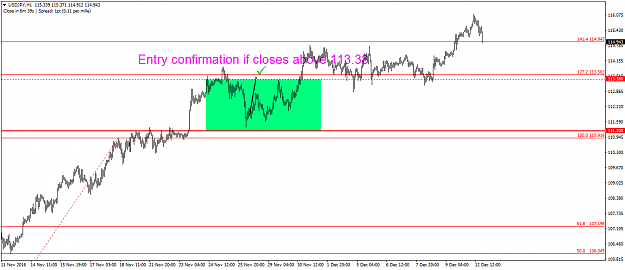
If you haven't done any of those two guidelines exemplified entries (no pending limit nor stop) and you want to entry to a more securely. If you have enough price constructed, you can draw a confirmation zone over the nearest pivot level, like I've done in the image below and you enter only when the price closes above it.
Attached Image (click to enlarge)
I've put an extra line (the dotted one) to highlight the upper level of the confirmation zone, in order to eliminate any doubts, hopefully, will not confuse you.
{quote} If you mean that how I can just entry another position, like on the USD/JPY case from the previous post (on a continuing trend), either you are entering after your last target is hit (127.2 or another target) and simply enter to another long targeting another level: 141.4 or 161.8 or you have a pending buy just 2-3 pips above your previous target (to cover the spread on the currency pair) or either just put a pending limit to gain some more pips, but what to do is to modify the pivot lines if necessary, when if the left of the chart your...
Ignored
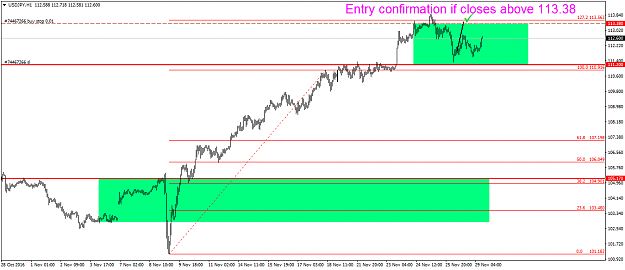
A little modifying should be made, in the sense that the pivot level that separates the upside area from the neutral area should be placed on 111.2 (from the previous 110.71 level). Now, with the newly constructed intra-day low of 111.348, the 111.2 pivot level seems to be fitter than the previous one, not to mention the reducing risk involved, in the case of a stop-loss hit after a long entry trigger.
{quote} Forex: USD/JPY, medium term analysis (quick update) The buy should continue towards 114.945 (141.4 Fibonacci extension of the upside move 101.183-110.71), the only thing that has modified is the nearest pivot level which is situated now on 110.71 and where the stop-loss should be placed. {image} Enjoy!
Commodities: XAU/USD (Gold), medium term analysis Just recently, the gold has entered into the downside area by closing under the 1262.98 level. Not only that but has also closed below the lower level of confirmation area, under the 1214.34 level. From current level, the price should go lower towards 1199.67 level and even lower - 1151.96 (127.2 Fibonacci level of the upside move 1199.67-1375.07), having the stop-loss on the nearest pivot level - 1262.98 {image}
Hello, this is a super thread, realy love your analyse.
You use the fibo levels even if there is no retracement, did i understand correctly?
I never consider a fibo that did not retrace until 23 level, but it seems to work just fine for you.
![Click to Enlarge
Name: [CAC40]Daily.png
Size: 40 KB](/attachment/image/2075835/thumbnail?d=1479924844)