I have a momentum indicator on my Mt4 but it is showing the price at 96.93, nowhere close to zero, I have it set to 10 like you said. Can you help
J
Ignored
the value is not so important.. it the sharpness of the bent and the direction of the indicator pointing. Usually 60 degreese or more determins a good momentum
If you look at the daily chart its still Bullish not bearish.
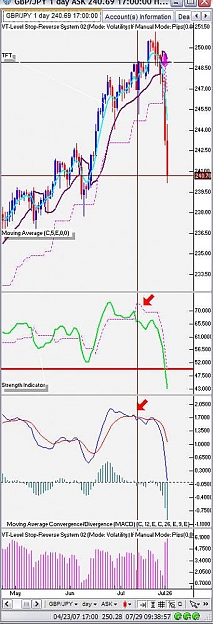
I'd consider the trend bearish if the low of 236.43 on 11th May is broken
Ignored
You may have a different strategy to identify the bearishness of the trend. I spotted the daily charts was bearish on the 12th of July when the price was @ 249.09 range and even when the price was @ 250 range I warned the members here not to go Long . suddenly it dropped over 1000pips..
One World Capital ($1,105,000) Velocity4X ($1,587,000)
Direct Forex LLC ($1,523,000)
FiniFX ($1,464,000) Forex Club ($3,304,000) GFS Futures & Forex ($3,074,000)
Nations Investments ($1,699,000)
Royal Forex Trading ($1,102,000)
SNC Investments ($1,565,000) FXDD ($781,000)
I Trade FX (-$3,039,000!!!!! Close to Bankruptcy!!!!) MB Futures ($3,080,000)
Money Garden ($3,399,844)
United Global Markets (Bankrupt)
Please note that all the dead walking firms still have enough time to come up with the minimum required capital of $5Million. But do you really want to trade your hard earned money with a broker who barely meets the minimum requirement?http://www.fxstreet.com/forum/images...n_confused.gif
i am using gfs forex & futures... it seems no problem with me... there platform is simple with few indicators that helps me as a novice... regarding their capital... compared to the account i opened with them, i have no worries because their clients account is separated with their company accounts.
i am making money using their clean and user friendly platform.
You may have a different strategy to identify the bearishness of the trend. I spotted the daily charts was bearish on the 12th of July when the price was @ 249.09 range and even when the price was @ 250 range I warned the members here not to go Long . suddenly it dropped over 1000pips..
Ignored
When I look at the charts with the given indicators on July 12th, they tell that the market is sideways. The price could go both ways either down from 247,60 or up from 249,00. Wonder how could you say it was bearish at that time?
You may have a different strategy to identify the bearishness of the trend. I spotted the daily charts was bearish on the 12th of July when the price was @ 249.09 range and even when the price was @ 250 range I warned the members here not to go Long . suddenly it dropped over 1000pips..
Ignored
Maybe I'm missing something but the Daily was not bearish at 249. Maybe overbrought but no way bearish. what makes you say this?
The very first trading course I will be attending is going to be on this friday for CFD(shares) .
Ignored
If you are looking into applying your methods to CFDs, you might want to take a look at http://www.chartsmart.com/
The monthly fee is quite correct, even for daily updates, and they have a scripting language to apply filters, so it is rather easy to find what you are looking for among the truckload of US stocks.
Disadvantage is that their smallest timeframe is daily.
Maybe I'm missing something but the Daily was not bearish at 249. Maybe overbrought but no way bearish. what makes you say this?
Ignored
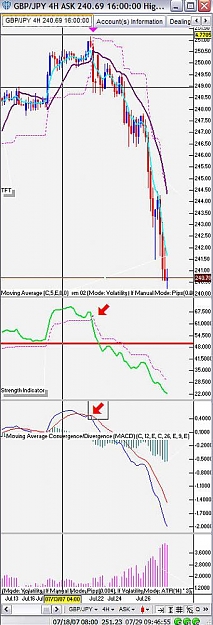
MACD cross over downwards on daily charts on the 11th of July.. Then I waited untill 4hr to cross downward and 1hr to cross down ward and also below through the Zero MACD to go short whch happend on the 20th(1hr)
|
Commercial Member
|
Joined Jul 2006
|2,566 Posts
Hey all,
I am having trouble finding indicators for MT4 and get them set right. Anyone else having that problem. If you have them please attach them to this thread or let me know where I can find them, because when I set what I got up they look nothing like Auslanco's chart.
MACD cross over downwards on daily charts on the 11th of July.. Then I waited untill 4hr to cross downward and 1hr to cross down ward and also below through the Zero MACD to go short whch happend on the 20th(1hr)
Ignored
I use MACD but my chart is different. No crossing on 1hr, 4h or daily on the 11th. I use 12,26,9 settings?
|
Commercial Member
|
Joined Jul 2006
|2,566 Posts
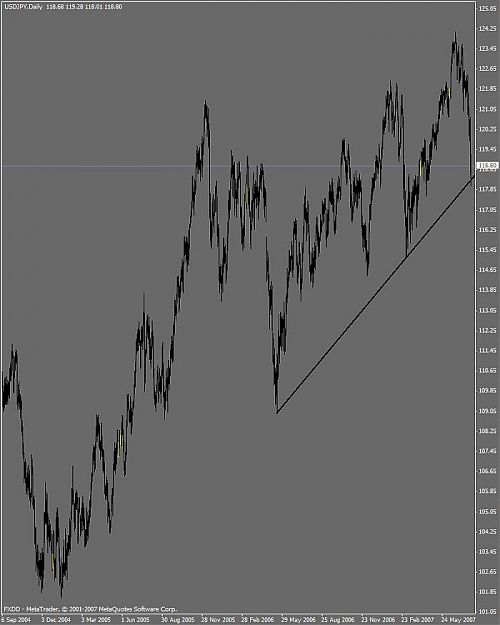
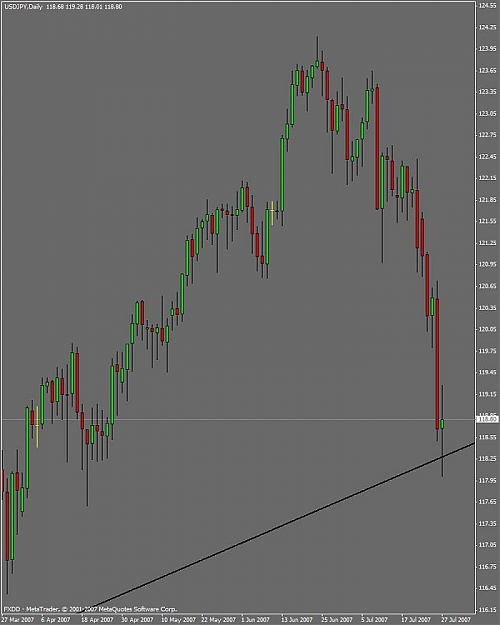
Here is something for the newbys to contemplate. I got the USD/JPY hitting a major uptrend line on the daily. Looks like a good indication for a trade. This is the type of thing to look for. Direction on the larger charts.....
Now, I don't know how this will affect the Geppy, but maybe Auslanco does.
Joined Feb 2007
|
Status: Trade @ your own risk
|6,628 Posts
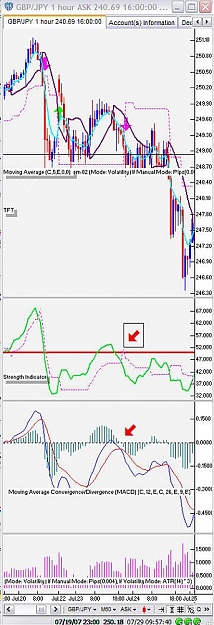
My typical entry point was here on the 22nd. ( I went short way above my typical entry point since it gave me a good oppurtunity to go short after the weekend retracement upto 250.40 area during early asian session.)
Here is something for the newbys to contemplate. I got the USD/JPY hitting a major uptrend line on the daily. Looks like a good indication for a trade. This is the type of thing to look for. Direction on the larger charts.....
Now, I don't know how this will affect the Geppy, but maybe Auslanco does.
Thanks, Jim
Ignored
Good point hard, thanks for sharing. I'm just biting my nails untill the asian open as my charts still got old updates on the indicators which was closed @ 1600 EST Friday. I may be able to tell you by monday morning, exactly whether it's due for a major retracement or shoot down another 200-300pips earley next week.
When I look at the charts with the given indicators on July 12th, they tell that the market is sideways. The price could go both ways either down from 247,60 or up from 249,00. Wonder how could you say it was bearish at that time?
Ignored
Thats why I didnt go short on the 12th. I waited for 4 hr and 1hr confirmation to go short which occured on the 23rd Monday early asian session.