IMO, GJ should head down now and break through bear flag. Let's see if I am right on this.
Added short 143
Ignored
that is ur decision and ur plan, trade safe none of the chart says short yet PA daily still showing possible correction i see no reason to short yet..
trade your chart
that is ur decision and ur plan, trade safe none of the chart says short yet PA daily still showing possible correction i see no reason to short yet..
trade your chart
Ignored
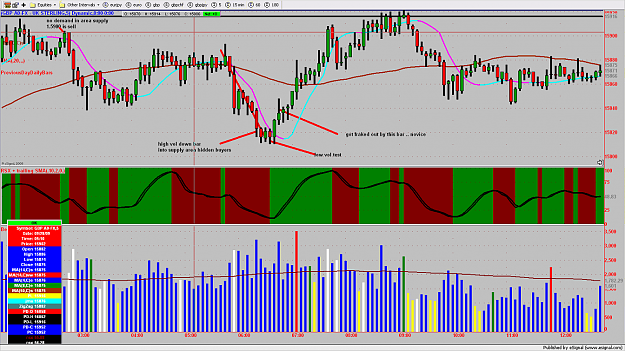
Reason for short: 143 area was 1hr 50ema with bearish divergence.
I do trade my own charts. SL @ BE
Do not follow my trades. Trade what you see on your own charts.
Reason for short: 143 area was 1hr 50ema with bearish divergence.
I do trade my own charts. SL @ BE
Ignored
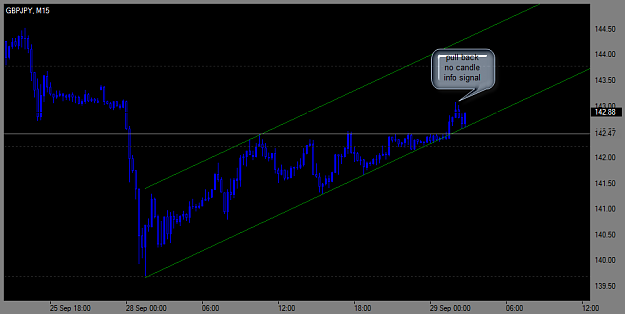
okay Bro..to my knowledge abt 50 MA on 1hr it seems to be pull back to test 142.50 right? so what of the 4hrs 50 ema ...that should be a strong resistance for good sell..
here is 15tf no signal for short so as i was saying that is a pull back signal and to ur 50ema on 4hrs price should test that too...IMO
okay Bro..to my knowledge abt 50 MA on 1hr it seems to be pull back to test 142.50 right? so what of the 4hrs 50 ema ...that should be a strong resistance for good sell..
Ignored
Agreed.
SL was blown.
Do not follow my trades. Trade what you see on your own charts.