Model 2: Averaging up/down + Grid
⇒Risk: Averaging down - Margin call risk for doing due to large lot size need to be purchased.
⇒Risk: Averaging up - Stop loss for each of the positions
⇒Reward: Averaging down - No profit as the net profit is balance
⇒Reward: Averaging up - Get more profit if it is trending
⇒My rating: Doing averaging up is good. Do not think about to do averaging down, because no profit to be made.
Please note there is a relation for model 2 and 3. So i post the model 3 together.
Model 3: Averaging up/down + Trailing BE + Grid
⇒Risk: Averaging down - Margin call risk for doing due to large lot size need to be purchased.
⇒Risk: Averaging up - Only the first grid level SL
⇒Reward: Averaging down - No profit as the net profit is balance
⇒Reward: Averaging up - Get more profit if it is trending
⇒My rating: Doing averaging up is good as the risk is small. Do not think about to do averaging down, because no profit to be made.
Both these model are also known as martingale method. However, how to use this method efficient and get more profit compare to normal method. Please check Martingale structure.
Martingale Structure
1. Apply multiple grid formation with trailing stop to breakeven price.
2. Apply lot multiplier instead of lot increment. So to have proper grid distant for price to fluctuate in order not to hit breakeven price easily.
3. Use S/R structure for this case, so there would have 2 outcome (Price either moves within the area or breakout)
4. Limit the number of grid formation, so this martingale structure can be closed once hit the final TP.
5. Assign stop loss for the first grid level position and assign all positions with TP (TP is y pips distant from the final grid level)
6. All positions are closed once market price hit breakeven price, 1st grid SL or final grid TP.
7. Add x pips profit to breakeven price. So if market is reversal, you would get x pips profit before all position is closed.
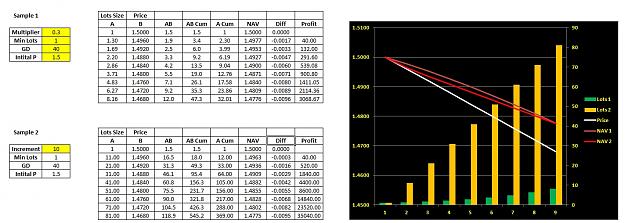
I show you the comparison by using lot multiplier and lot increment. Which is the best and why. Please just see the Lot size, price, NAV and profit inside the excel table. You can ignore the other and i am not explain the calculation because this is not important.
Sample 1 is using lot multiplier. Formula is Subsequent grid lot size = Previous grid lot size + (Previous grid lot size x lot multiplier)
Sample 2 is using lot increment. Formula is Subsequent grid lot size = Previous grid lot size + lot increment
As you can see the NAV (Breakeven price) for both sample, both achieve the same function but sample 2 use larger lot size. You can study the chart as well.
Chart Legend
Left value is price
Right value is lot size
Bottom value is grid position
►Conclusion:
Can you see the profit. You can get many pips if market is trending, and there is no risk after 2nd grid level and above are triggered because trail the stop to BE price. So if market is ranging, you get breakeven + x pips profit.
⇒Risk: Averaging down - Margin call risk for doing due to large lot size need to be purchased.
⇒Risk: Averaging up - Stop loss for each of the positions
⇒Reward: Averaging down - No profit as the net profit is balance
⇒Reward: Averaging up - Get more profit if it is trending
⇒My rating: Doing averaging up is good. Do not think about to do averaging down, because no profit to be made.
Please note there is a relation for model 2 and 3. So i post the model 3 together.
Model 3: Averaging up/down + Trailing BE + Grid
⇒Risk: Averaging down - Margin call risk for doing due to large lot size need to be purchased.
⇒Risk: Averaging up - Only the first grid level SL
⇒Reward: Averaging down - No profit as the net profit is balance
⇒Reward: Averaging up - Get more profit if it is trending
⇒My rating: Doing averaging up is good as the risk is small. Do not think about to do averaging down, because no profit to be made.
Both these model are also known as martingale method. However, how to use this method efficient and get more profit compare to normal method. Please check Martingale structure.
Martingale Structure
1. Apply multiple grid formation with trailing stop to breakeven price.
2. Apply lot multiplier instead of lot increment. So to have proper grid distant for price to fluctuate in order not to hit breakeven price easily.
3. Use S/R structure for this case, so there would have 2 outcome (Price either moves within the area or breakout)
4. Limit the number of grid formation, so this martingale structure can be closed once hit the final TP.
5. Assign stop loss for the first grid level position and assign all positions with TP (TP is y pips distant from the final grid level)
6. All positions are closed once market price hit breakeven price, 1st grid SL or final grid TP.
7. Add x pips profit to breakeven price. So if market is reversal, you would get x pips profit before all position is closed.
I show you the comparison by using lot multiplier and lot increment. Which is the best and why. Please just see the Lot size, price, NAV and profit inside the excel table. You can ignore the other and i am not explain the calculation because this is not important.
Sample 1 is using lot multiplier. Formula is Subsequent grid lot size = Previous grid lot size + (Previous grid lot size x lot multiplier)
Sample 2 is using lot increment. Formula is Subsequent grid lot size = Previous grid lot size + lot increment
As you can see the NAV (Breakeven price) for both sample, both achieve the same function but sample 2 use larger lot size. You can study the chart as well.
Chart Legend
Left value is price
Right value is lot size
Bottom value is grid position
►Conclusion:
Can you see the profit. You can get many pips if market is trending, and there is no risk after 2nd grid level and above are triggered because trail the stop to BE price. So if market is ranging, you get breakeven + x pips profit.
Attached Image (click to enlarge)
1