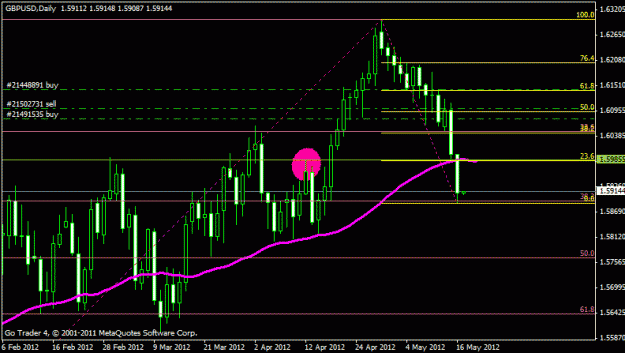
2 very simple charts.
Daily and weekly.
Daily shows some current 55ema support which I think will give way and head to 59 area where there is a strong daily reaction candle in red area and very good resistance turning support in the blue area
Weekly shows very good confluence with 1.59 area/38.2 fib, 200sma and 55 ema coming together for lunch.
How nice...
Lets see if price will join them for an orgy
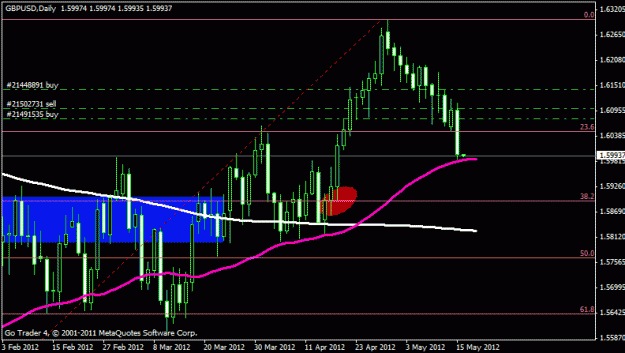
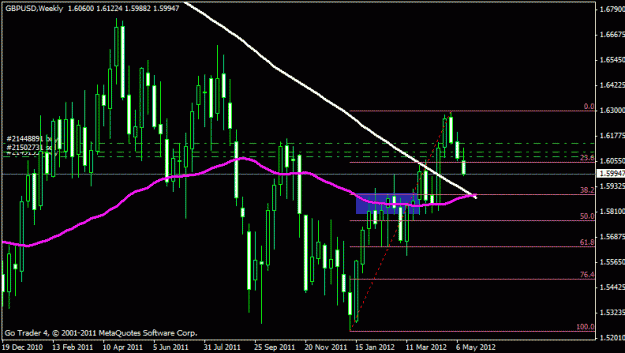
Attached Image(s) (click to enlarge)
Come with me if you want to live....