DislikedYou study candles, you said. I didn't see notes for them on a chart of yours that is interesting, and I did see a really neat s/r line you may find useful (since I'm on simulator); the upper two lines are likely of much less value, longterm:
......................
Although I do see your going for causation, because I don't know the reason the s/r line I added should work, except for the unusual symmetry of the patterns around it.
The two upper lines are a pattern I'm more used to drawing.Ignored
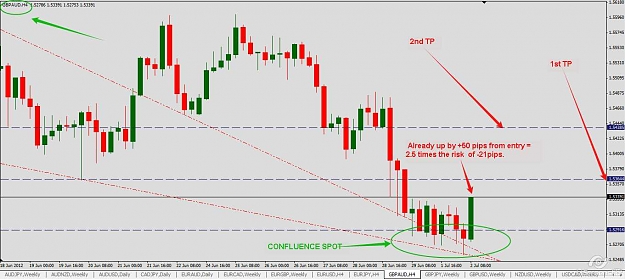
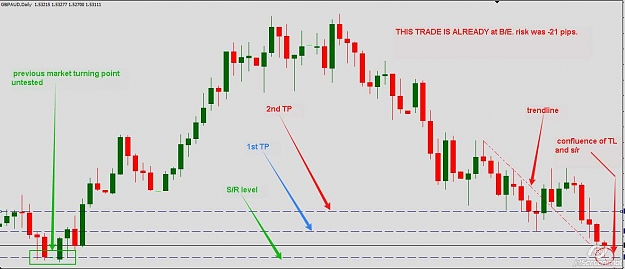
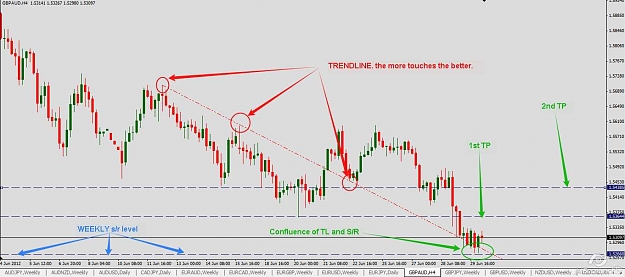
below you can see the confluence spot...created by TL(3 touches minimum) combined with WEEKLY s/r LEVELS(untested level) that also serves as a previous market turning point. check chart #1 and #2.
When price reached that confluence spot...i switched to 5mins time frame...and look for a 1,2,3 formation....or a W formation if you like...at the completion of that 1,2,3 formation...i entered...the bottom of that formation is my SL and the top my entry point...making my risk = -21 pips roughly......check chart #3.
I B/E trade when price reach LAYERS OF resistance that i think are mildly significant(those layers have to be at least 1:1 away otherwise i wont enter the trade.). There are ways to B/E...you can offset your risk by selling some...or moved SL to entry point.
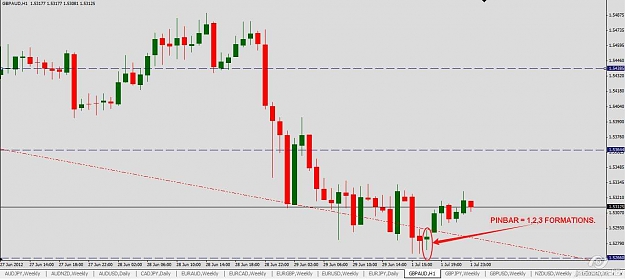
YOU TALKED ABOUT CANDLES. Yes...but candles are simply chart patterns like i have said before...isolate the boundaries of any candles and go to lower and lower time frames...you will slowly see that candle or candle pattern morph into a familiar classic technical pattern. This also happens in this case. Look at the 1,2,3 formation(marked on the chart)...on the H1 chart..it is clearly a pinbar. check chart #4.
anyways, there are more explanations on the charts.
Attached Image(s) (click to enlarge)

" It may mean something. It may mean nothing at all "