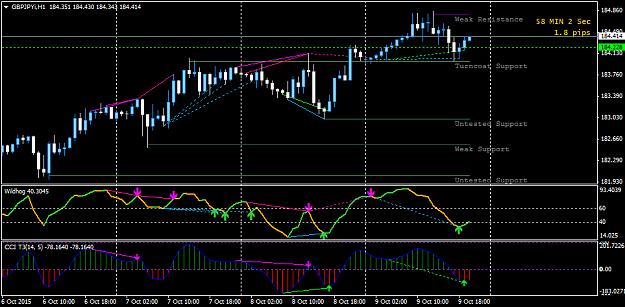
Trade I took based off of multiple reasons. Price came back and tested support for the first time, inside candlestick printed, and hidden bullish divergence printed all at the same time!
Trade I took based off of multiple reasons. Price came back and tested support for the first time, inside candlestick printed, and hidden bullish divergence printed all at the same time! {image}
Ignored
Guys this is the importance of confluence. When you have multiple reasons like above to enter a trade you greatly increase the probability of success. I do not trade every divergence setup..you will lose more then you will win if you do. I trade divergence that has confluence, multiple reasons to enter the trade. Every trade you take should have more than one reason to enter the trade, I like more than two just like the above picture.
.... I know about a veteran trader who learned a lot from his father, a trader also.
He says, look for the five "forces" which will bring you the most possible success.
TREND, MOMENTUM, S+R levels, Fractals (meant is MTF) check by looking for example in the M15 if a early entry in H1 is developing and the last force is....can`t remember, have to search....maybe whisky for get the balls to get in the trade or something...
I will check his name, some pics and all 5 forces for you
You know, crossing -100 or 0 or 100 are important momentum....moments so to speak.
And a strat in itself are divs above 100 and below -100. Check it out for example in the pic I posted
(last Aqua line with arrow up) below -100 aaand up it goes.
This strategy is normaly shown by the regular cci in MT4 setting is cci 10.
Hey all. Here is a nice win I had today. If you take a look at my trade explorer I started this new account trading divergence only the 23rd of September and so far I am up 86%. Divergence is working out nicely so far!
|
Joined Apr 2008
|
Status: If you harken unto the voice of GOD
|253 Posts
Hi Piptime and all. I've been using this method for a while now and i must say it great. The problem I've found is that it gets some awkward trades when going against an established trend. The rules don't say a thing about how to manage those kinda scenarios, so piptime, pureprice, everybody, what do we do in situations like that.
Hi Piptime and all. I've been using this method for a while now and i must say it great. The problem I've found is that it gets some awkward trades when going against an established trend. The rules don't say a thing about how to manage those kinda scenarios, so piptime, pureprice, everybody, what do we do in situations like that.
Ignored
Hi Wahnone,
When deciding to take a trade make sure there are more reasons to take the trade then just divergence. Use divergence as a heads up so to speak. After you see divergence is occurring look for where price is at...is it at a place of interest like support/resistance. If so then great...next how is price reacting to that area...what candlesticks are printing. If a certain candlestick prints that has a high probability of making price reverse...then good! Also know when to get out...I hate being in trades for a long period of time...actually I love when price moves 100-200 pips in my favor and getting out. Im usually in a trade for 1-2 hours at most, especially if the trade is against the overall trend. Learn all those things and it will be really hard for you to lose.
Hi Piptime and all. I've been using this method for a while now and i must say it great. The problem I've found is that it gets some awkward trades when going against an established trend. The rules don't say a thing about how to manage those kinda scenarios, so piptime, pureprice, everybody, what do we do in situations like that.
Ignored
Wahnone,
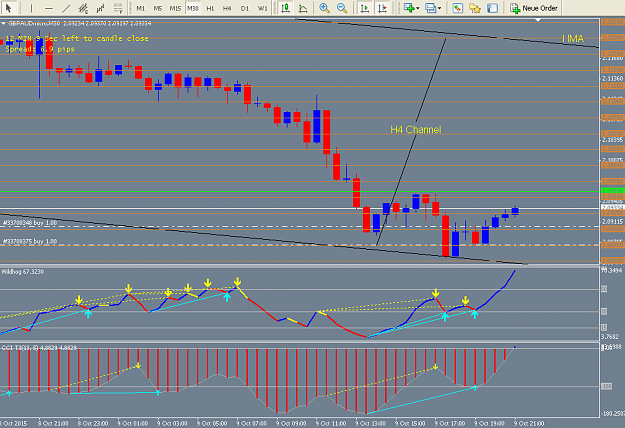
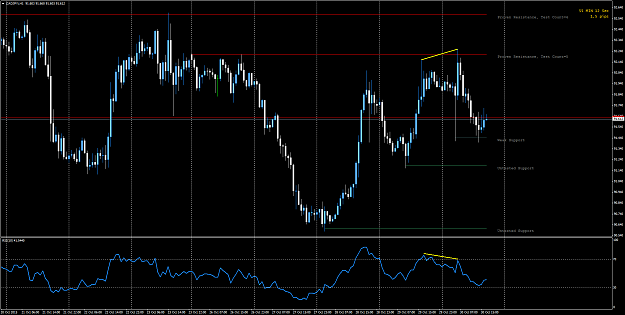
Here is a current situation on CAD/JPY. As you can see divergence has printed. I have yet to enter the trade though due to price action. I am patiently waiting for the right candlestick to print before placing my sell. Since there is so much volume to the upside at the moment, once I get into my trade I will be looking for a really quick exit. This has to much upside which means the TP has to be smaller. We will wait and see what price action does to confirm a trade. This is how I approach Divergence.
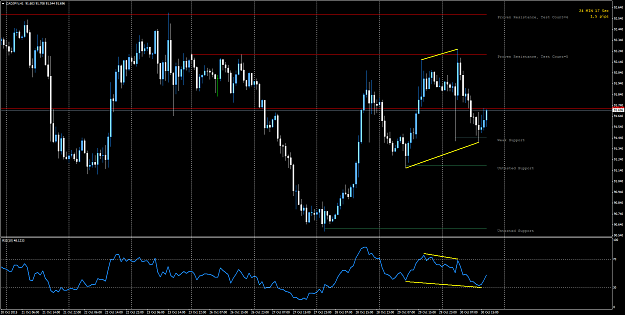
Still no trade presented for us. I imagine price is going continue up to 92.200 area before a small break down. We shall see! {image}
Ignored
Hey guys looks like price did as I thought it would do although the break down was much larger than I anticipated but that's great news for whoever caught this trade!
.... I know about a veteran trader who learned a lot from his father, a trader also. He says, look for the five "forces" which will bring you the most possible success. TREND, MOMENTUM, S+R levels, Fractals (meant is MTF) check by looking for example in the M15 if a early entry in H1 is developing and the last force is....can`t remember, have to search....maybe whisky for get the balls to get in the trade or something... I will check his name, some pics and all 5 forces for you
Ignored
Well as he is a very successful commercial trader/marketing expert, I won`t promote him here.
But he is one of the very rare good guys (Barry B.)
So his trading is always spinning around the 5 forces: Trend (MA 50 exp., close), Momentum (any momentum indi),
S+R levels, Fractals (he is checking the next higher tf) and
Cycles of PA (not sure about that because I did not buy his system/course, but I guess it can be a oscillator like stochastic 5,3,3
Yes once I see divergence print then I start looking for more reasons to take the trade. Price action (candlesticks), support resist, trend lines, news (if any is coming or just happened). I am a student and continue pursuing knowledge on trading but if someone asked me what to learn to trade divergence I would suggest learning in this order.
There are many different settings and nobody knows which one is best.
I use rsi 5, close because 5 periods are a fib-number (fib is important in timing too), 5 is not too quick and not to slow, but the most important part is the levels. I use 15 and 85 as over S and over B. Very good trades are coming from these levels (any tf) and very, very good trades if you get divergences starting from those levels.
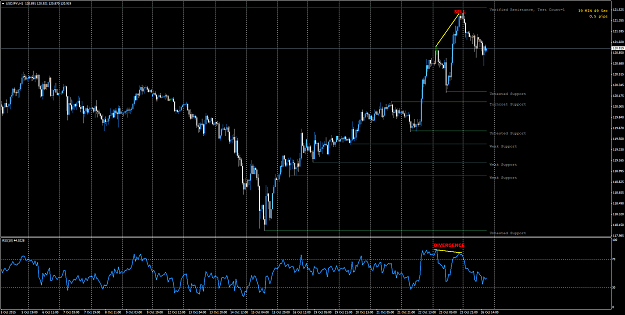
{quote} I do not think that there is divergence yet on this particular chart. You are drawing the lines from the highs of the candles but I believe that the RSI is based on the close of the candles. On the next chart that you posted the divergence did actually occur as the there was a higher close but the RSI kept going down.
Ignored
Actually there was a higher high. You draw the divergence lines on the candle wicks. The second high was made when price went higher than the previous high. Do you know what divergence is? I have posted a cheat sheet chart on divergence a few weeks ago in this thread. I will post it again so you can learn how to spot divergence.
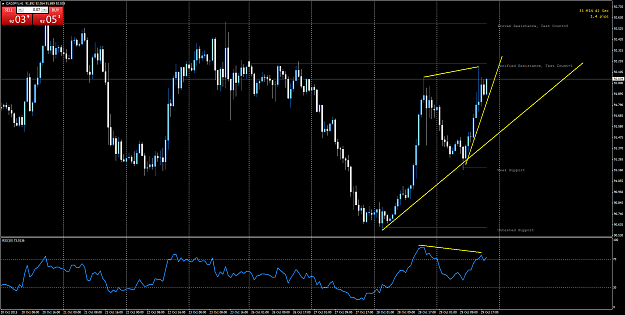
Hey Wolf, Yes once I see divergence print then I start looking for more reasons to take the trade. Price action (candlesticks), support resist, trend lines, news (if any is coming or just happened). I am a student and continue pursuing knowledge on trading but if someone asked me what to learn to trade divergence I would suggest learning in this order. 1. Support/ Resist 2. Candlestick Analysis (Price Action) 3. Divergence 4. Money Management After you have learned those 4 things I would then suggest demoing for a few months for practice. {image}...
Ignored
98% true.
To be realy successful we need the 2% missing. Trading with real money makes this little difference. As you know it is the mental hurdle that keeps us away from the money. Technical a 10 year old boy could check the trades and pull the trigger.
Even if you trade with very small lots, but real money on the table is the best mental training you can get.
Piptime, let us talk a bit about the rsi settings, please. There are many different settings and nobody knows which one is best. I use rsi 5, close because 5 periods are a fib-number (fib is important in timing too), 5 is not too quick and not to slow, but the most important part is the levels. I use 15 and 85 as over S and over B. Very good trades are coming from these levels (any tf) and very, very good trades if you get divergences starting from those levels.
Ignored
Hey Wolf,
I also believe 5 is to fast. I am currently using 10 and have had success with it. In terms of levels I never really thought to trade divergence this way, I know those levels represent overbought/oversold but I like to look at the chart and see where price is at (suppor/resist). Usually when price hits these levels rsi is around 85/15 which adds another reason to take a trade. Wolf thank you for your input, I like to try and learn new things from other traders.
{quote} Hey Wolf, I also believe 5 is to fast. I am currently using 10 and have had success with it. In terms of levels I never really thought to trade divergence this way, I know those levels represent overbought/oversold but I like to look at the chart and see where price is at (suppor/resist). Usually when price hits these levels rsi is around 85/15 which adds another reason to take a trade. Wolf thank you for your input, I like to try and learn new things from other traders.
Ignored
....you are welcome.
I am sure this is the only way to learn... input from other traders...different views. That is what makes this platform so valuable.
Another thought about rsi 5 85/15... if you work like barry b. and check the "fractals" in more than one tf and look for touching the levels in M15, M30 and H1, you will find some good trades. Check it out please.