Appreciate the post and thanks for the comments. I didn't see a short setup in EU myself, although I see where the supply area was.
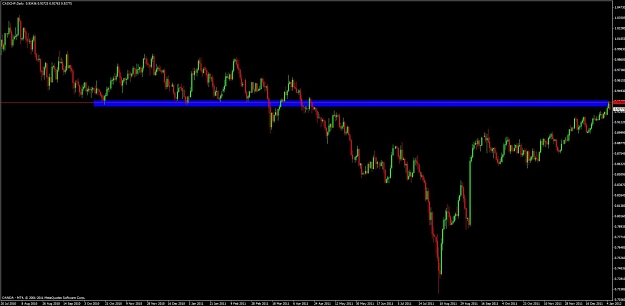
It's a method of plotting charts I've seen a few times, marking the actual supply and demand locations, rather than the pivots (although they tend to frequently be the same level). I think it's Ifmyante who plots their charts in a similar way. I like it, but I always like to see a future supply area to have acted as large support or large resistance in history, if that makes sense.
I'll check out no masks thread. I'll try and keep this one going! If for no one else, it's nice to have a record of everything.
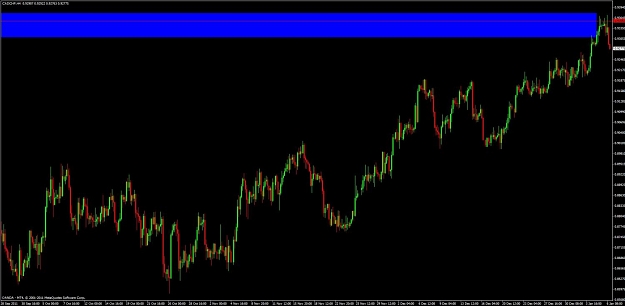
DislikedTook a short at green hashed line and exited at red hashed line. Felt that strong drop was an area where more sellers with unfilled orders were lurking. I do use MACD and BBs as confirmation tools but mainly I like S/D levels. This trade for me entered a strong supply area and a short was confirmed.
I very much like the way you map out S/R areas and will be following your posts and charts. I followed no masks thread for a good while. He traded between large round numbers but he has not been around in a good while and that thread pretty much...Ignored