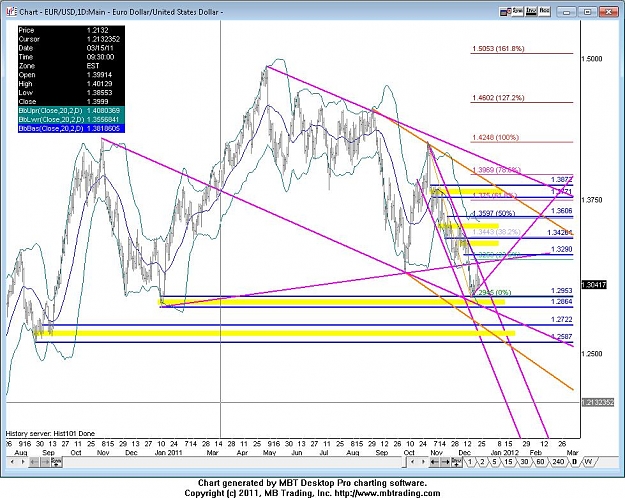
I use an almost naked bar or candlestick chart to identify supply and demand levels, swing highs and lows, support and resistance and keep an eye on Fibbonachi levels. I have the Bollenger bands with the standard settings on this chart too.
I like to cram the bars or candles tight together. It makes it easy to see supply and demand levels as well as support and resistance. For a little education on identifying supply and demand levels watch some of the webinars by Sam Sieden . That's exactly how I was taught and pretty much what I do. Unlike Sam, I do include the lower wicks on supply levels and the upper wicks on demand levels.
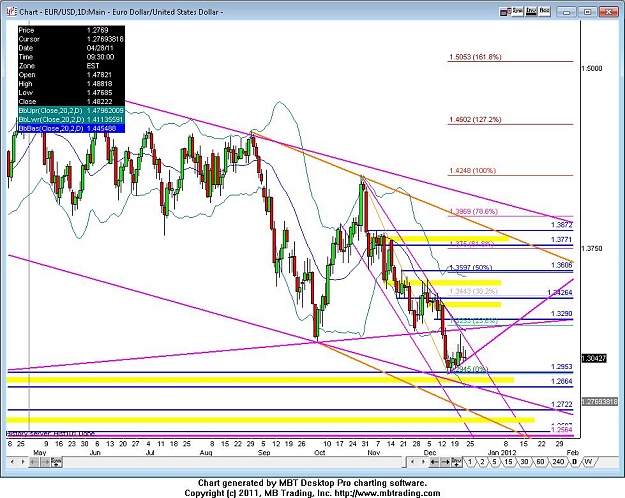
I like to cram the bars or candles tight together. It makes it easy to see supply and demand levels as well as support and resistance. For a little education on identifying supply and demand levels watch some of the webinars by Sam Sieden . That's exactly how I was taught and pretty much what I do. Unlike Sam, I do include the lower wicks on supply levels and the upper wicks on demand levels.
Attached Image (click to enlarge)
Attached Image (click to enlarge)
I don't care which way the market is going as long as it's going my way