All this is just a very complex way of saying:
Pick the highs and lows off the longerterm charts. Draw them across your chart.
Then figure out a way to tell if price will reverse when it reaches them as it tends to do this quite often.
The supply/demand zone is way too complicated as it obscures the issue-just look at how confused people can be with it!
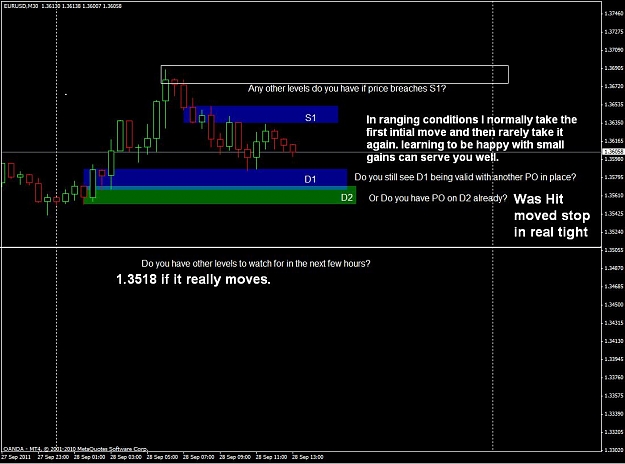
Also, the 'zones' are quite wide-are you picking the area where price accelerated out of a consolidation period and not the actual area where it reversed in the first place? Why do that?
Just pick the highs/lows on 1 hour charts (if day trading) as those are the areas where the supply/demand ratios reversed, and will most likely do so again. It's really not that complicated, I think a lot of Seiden is overly intellectual and slightly long winded, hence the confusion. But that's just my opinion-good luck
Pick the highs and lows off the longerterm charts. Draw them across your chart.
Then figure out a way to tell if price will reverse when it reaches them as it tends to do this quite often.
The supply/demand zone is way too complicated as it obscures the issue-just look at how confused people can be with it!
Also, the 'zones' are quite wide-are you picking the area where price accelerated out of a consolidation period and not the actual area where it reversed in the first place? Why do that?
Just pick the highs/lows on 1 hour charts (if day trading) as those are the areas where the supply/demand ratios reversed, and will most likely do so again. It's really not that complicated, I think a lot of Seiden is overly intellectual and slightly long winded, hence the confusion. But that's just my opinion-good luck
1