|
Commercial Member
|
Joined May 2011
|3,012 Posts
The pairs I am watching now are eurusd, gbpusd, audusd, nzdjpy and audjpy. If you look at the monthly charts these could be ones to get some nice entries on at break even and then just hold them for months.
Hi Hugh.
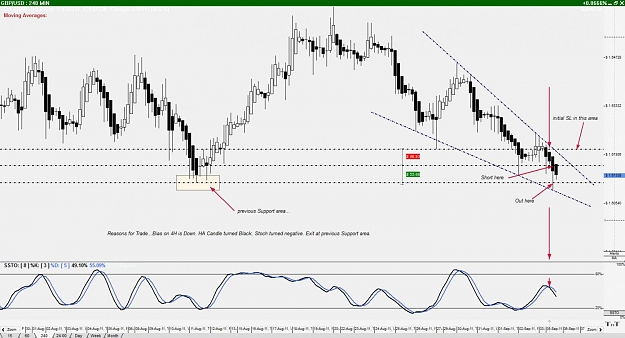
If you don't mind , can I throw a chart at you for some feedback.... ...
Its a pretend/demo trade , no risk... just trying to figure out the Market....
Draw up what I think I see using the methods talked about here.
Cheers
SR
Ignored
That's in and out a bit quick for me. If you've sold with the trend just hold it until the HA candles change colour against your trade. Preferably once you've got a good trade at break even then move up a time frame and manage the trade there.
The Heiken Ashi on GbpUsd monthly is red and the stochs are high, we could be in for a good drop here, maybe open 2 positions and manage one on the daily and one on the weekly or even monthly until it turns?
The pairs I am watching now are eurusd, gbpusd, audusd, nzdjpy and audjpy. If you look at the monthly charts these could be ones to get some nice entries on at break even and then just hold them for months.
Ignored
About 50 pips up on all of these except audjpy, I didn't want to double up too much on the same currency. I'll leave these for a while now and try and get another entry in 100 or 200 pips time.
The Heiken Ashi on GbpUsd monthly is red and the stochs are high, we could be in for a good drop here, maybe open 2 positions and manage one on the daily and one on the weekly or even monthly until it turns?
Ignored
Montly and Weekly looks like sell indeed, but when I look at the Daily the stoch is oversold.
Also the EMA 100 and 200 are slightly up with the 100 above the 200.
I think I'll wait until a retrace on the daily before entering.
I did went short on USDCHF and EURCHF today with help of your system.
I am a bit late in actually, because on both pairs there have been some down HA candles already, but I just started today with this system.
The pairs you suggested I didn't take. Mainly because the pairs go against or are circling around the 100 and 200EMA.
Maybe I give those EMA's to much credit. Don't know yet. But better safe than sorry and better patience than rush into a trade because I "have" to trade!
Montly and Weekly looks like sell indeed, but when I look at the Daily the stoch is oversold.
Also the EMA 100 and 200 are slightly up with the 100 above the 200.
I think I'll wait until a retrace on the daily before entering.
I did went short on USDCHF and EURCHF today with help of your system.
I am a bit late in actually, because on both pairs there have been some down HA candles already, but I just started today with this system.
The pairs you suggested I didn't take. Mainly because the pairs go against or are circling around the 100 and...
Ignored
I know what you mean so yes it may be best to wait for a retrace on the daily (look at the 4 hour!) but oscillators can stay oversold for a long time. I've just put pending orders on all pairs below the next s/r and if they get hit then the first order will be at breakeven so my risk will stay constant or I wil have some profit locked in. If it keeps going down and I get some more pending orders hit then I'll definitely have profit locked in. We'll see how it goes, if it does retrace I'll just renter after the retrace. Somehow I want to get those 4 or 5 entries and hold them on the monthly.
Also the 100 and 200 ema's are lagging indicators so the start of a downtrend won't pull them into line straight away. These days I'm giving MUCH more weight to the higher timeframes.
|
Joined Aug 2010
|
Status: The Forex Farmer
|175 Posts
Thanks for the reply.
I learned that buying/selling just above/below a swing high/low is a good thing, because the odds the trend continues are better. Support turns in a resistance and vice versa, so the trend has new room to continue.
Perhaps indeed a good idea to first open positions when the heiken ashi candles change collors (with trendline / stoch / higher timeframe confirmation) and to add positions on the break of the latest high/low, like you're doing in your latest post.
Also it is true that EMA's lag and stoch can be long in overbought/oversold, so I will keep that in mind!
That's in and out a bit quick for me. If you've sold with the trend just hold it until the HA candles change colour against your trade. Preferably once you've got a good trade at break even then move up a time frame and manage the trade there.
The Heiken Ashi on GbpUsd monthly is red and the stochs are high, we could be in for a good drop here, maybe open 2 positions and manage one on the daily and one on the weekly or even monthly until it turns?
Ignored
Thanks for the reply Hugh.
Im still trying to work out which time frame is bet to watch, given my demo Acct has 5K in it, and the smallest I can go down on pip size is 1 pip = 1$.
This is why I look at the 4h or 1H charts. As stated above, sometimes the timeframes give conflicting Stoch crosses, which leaves me unsure if I should take the trade because of oversold/overbought on the time frame below. Probably better to wait until theres a retrace then take the trade when both line up in the same direction ?
|
Commercial Member
|
Joined May 2011
|3,012 Posts
That could've worked out better. Swiss National Bank got involved in eurchf and sent everything else flying with it. I've still got a couple of positions open of the originals and when everything settles back down I'll be back to plan A.
Great thread and system Hugh. I've been trying to find a simple, proven system that I can trade on both long and short time frames and just come across your thread.
I'd love to hear how you trade the lower time frames using this method and see how it differs and your thoughts on how well it works. How does it vary from the daily system? What time frame/s are you working with? Do you use different MA and Stoch settings on the lower TFs? Does your win/loss ratio drop at the lower TFs?
At the start of this thread (or maybe the original one?) I spoke at length about new traders needing to only trade daily charts until they get it right. I'm still of that opinion but over the summer whilst it has been quiet I have been trading 1 and 5 min charts using a very similar method to my daily system.
My own personal view is that you shouldn't be afraid of trading the smaller timeframes. Daily takes a lot of patience because you can sit and watch the charts for weeks and not have a clear and valid signal and then you get one and promptly...
Hi Hugh
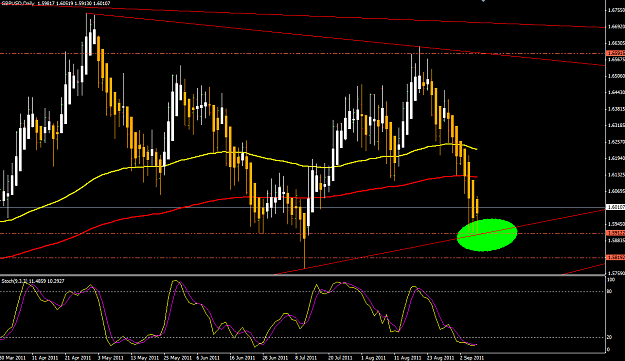
I've been reading your thread with interest. Through long and sometimes painful experience (blow account), I've come to the conclusion that higher timeframes are the ones to trade. I've attached a chart of GbpUsd. Can you tell me if I've setup the trendlines and resistance lines correctly ? and if so is my assumption regarding the next trade correct ?
Great thread and system Hugh. I've been trying to find a simple, proven system that I can trade on both long and short time frames and just come across your thread.
I'd love to hear how you trade the lower time frames using this method and see how it differs and your thoughts on how well it works. How does it vary from the daily system? What time frame/s are you working with? Do you use different MA and Stoch settings on the lower TFs? Does your win/loss ratio drop at the lower TFs?
Thanks,
J
Ignored
Hi PB, the lower timeframe system is a work in progress at the moment but I'm making progress slowly. At the moment I am just trading eurusd on a 5 min chart and the indicators have stayed more or less the same. The win/loss ration is lower at the moment but I believe with experience and practice it will be improved. As soon as I have settled on the plan I will start a new thread to discuss it.
Hi Hugh
I've been reading your thread with interest. Through long and sometimes painful experience (blow account), I've come to the conclusion that higher timeframes are the ones to trade. I've attached a chart of GbpUsd. Can you tell me if I've setup the trendlines and resistance lines correctly ? and if so is my assumption regarding the next trade correct ?
Ignored
The chart looks fine to me and that is definitely a good place to look for a trade. You've got trendline and horizontal s/r. Wait to see a clear heiken ashi change combined with the stochs crossed and moving back up above the 20 level. Remember to keep your position size relatively small because it may give you a perfect looking entry and then still go wrong. It happens. The trick on the higher timeframes is to be able to weather a few 200 pip losses in a row before you hit a run of 500 or 600 pip trades in a row!
Hi PB, the lower timeframe system is a work in progress at the moment but I'm making progress slowly. At the moment I am just trading eurusd on a 5 min chart and the indicators have stayed more or less the same. The win/loss ration is lower at the moment but I believe with experience and practice it will be improved. As soon as I have settled on the plan I will start a new thread to discuss it.
The chart looks fine to me and that is definitely a good place to look for a trade. You've got trendline and horizontal s/r. Wait to see a clear heiken ashi change combined with the stochs crossed and moving back up above the 20 level. Remember to keep your position size relatively small because it may give you a perfect looking entry and then still go wrong. It happens. The trick on the higher timeframes is to be able to weather a few 200 pip losses in a row before you hit a run of 500 or 600 pip trades in a row!
Ignored
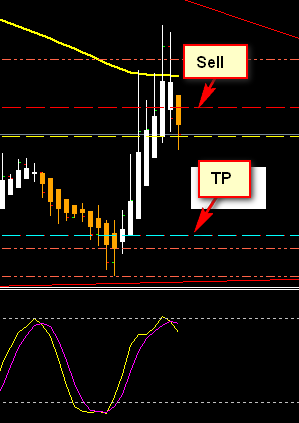
Thanks for that Hugh. I was working from home today, so was able to keep an eye on the charts, and I saw that the Gbpusd had spiked through resistance and the 100ema on the hourly chart, the HA had changed colour, so reasoning that it is hopefully going to hit my buy point on the daily chart I posted earlier, I took a quick small sell trade. Reading your post on using lower timeframes made me look at the possibility. I'm at breakeven now so nothing to lose. :0)
Thanks for that Hugh. I was working from home today, so was able to keep an eye on the charts, and I saw that the Gbpusd had spiked through resistance and the 100ema on the hourly chart, the HA had changed colour, so reasoning that it is hopefully going to hit my buy point on the daily chart I posted earlier, I took a quick small sell trade. Reading your post on using lower timeframes made me look at the possibility. I'm at breakeven now so nothing to lose. :0)
Ignored
Looks good but why set a take profit? What if the price rockets through that level? Better to stay at break even until the heiken ashi changes against you which may be soon or may be next week. If you're of a nervous disposition and don't like to give profits back then trail the stop loss 5 pips above the top of the heiken ashi 2 before the current candle to lock in profit as the trade matures but protect you in case it spikes upwards.