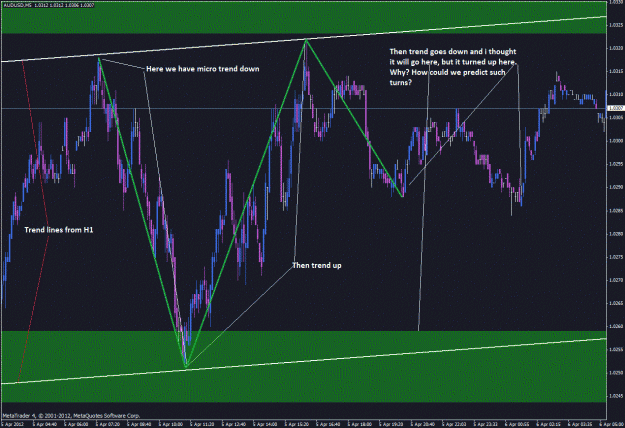
DislikedSorry mate i had you looking at the wrong charts/diagrams
I am talking about the diagrams on pages 15, 16 and 17
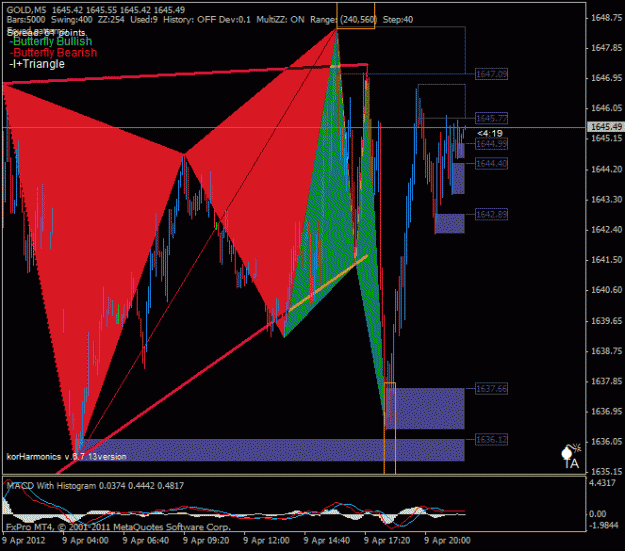
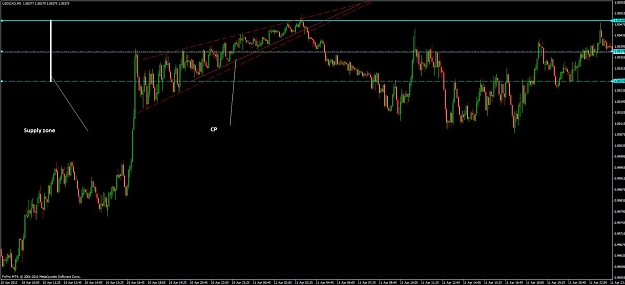
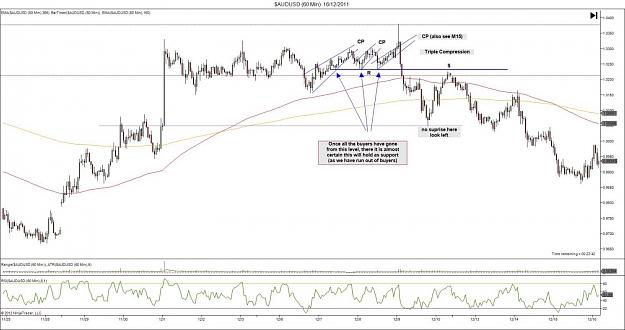
In those you have demand moving down (red arrows) and supply moving up (green arrows) Thats the part i think will confuse newbies as it confused me abit.
I dont think you really need any of that as you have already explained supply and demand so well previously in the document.Ignored
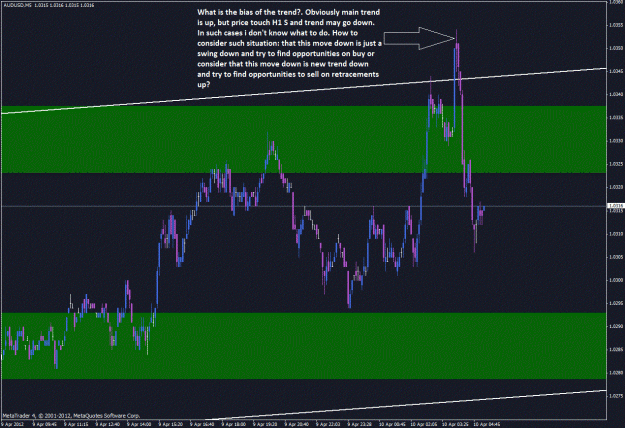
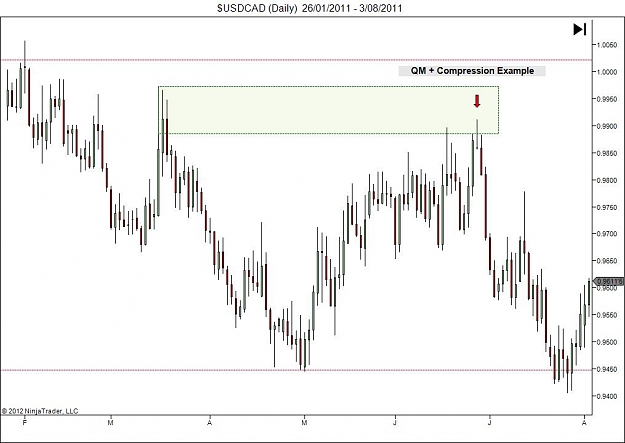
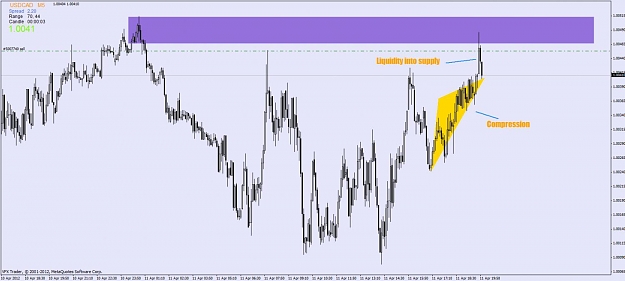
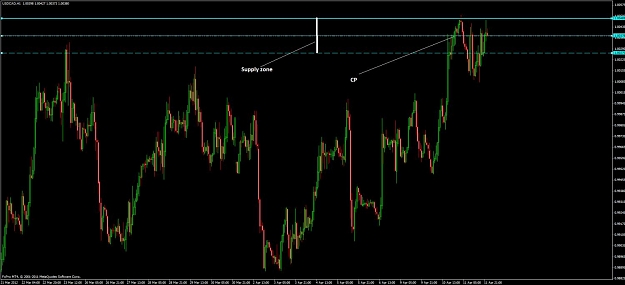
But price is always established by supply + demand. Thats why we search for the cross of those two lines. This is the general supply/demand chart layout out of the economics. supply rising, demand falling.
regards,
Jonas
Ps : http://www.forexfactory.com/showthread.php?p=5553348#post5553348
Hero calls followed by margin calls...