Dislikedwhere did you place the stop at? 786 or x?
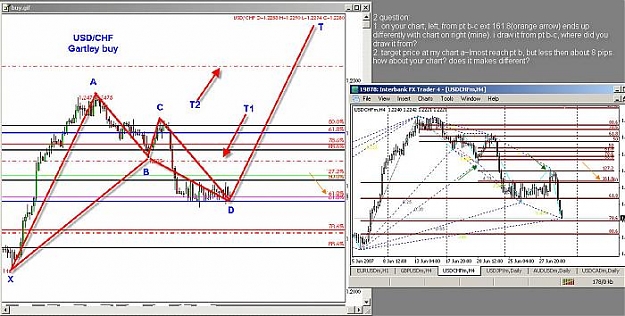
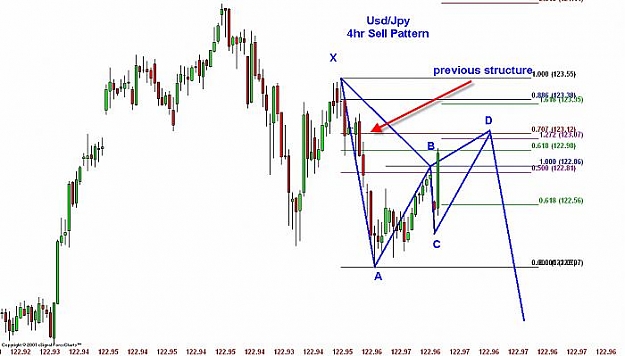
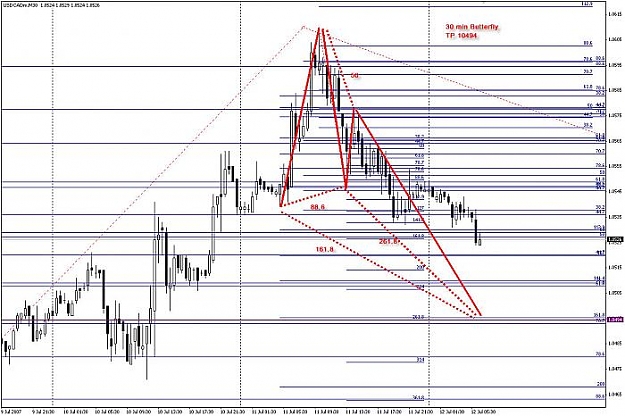
also, my 1618 is ext from c-d, this doesnt make cluster with 618 from x-a. my 1618 cluster with 50 from x-a.
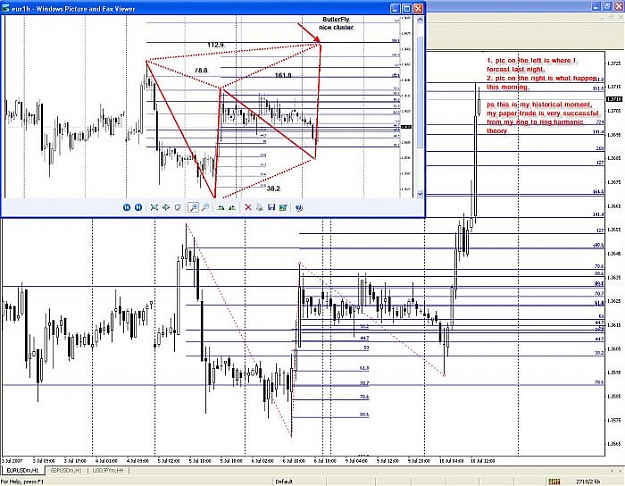
can you show frame by frame at how did you draw the fib? fraom pt to pt?Ignored
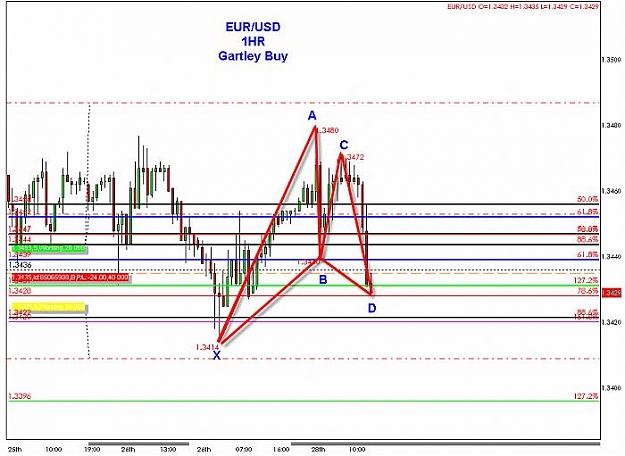
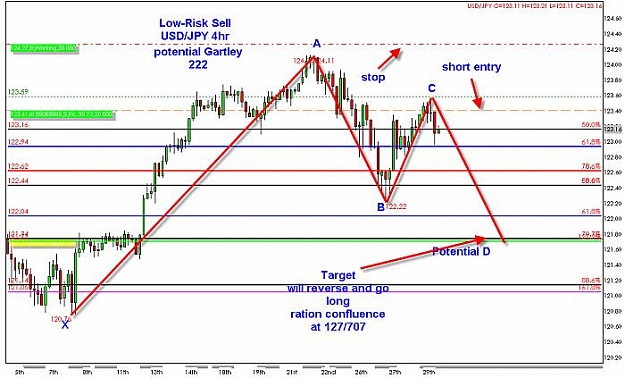
As you can see, there is a red dotted line right below the .786 retrace of the X to A leg. That is where I have placed my stop. These patterns are very subjective,they are not mechanical in nature meaning that they don't have very specific entry and exit rules. They require discretion which may not be suitable for the beginner. (at least that's the way it was for me) Sometimes on these" higher-risk patterns", I will place my stop either below the .786 or .886 or vice verse for a sell pattern. I like to keep the risk as low as possible and keep them to at least a 1:3 Risk to Reward ratio.
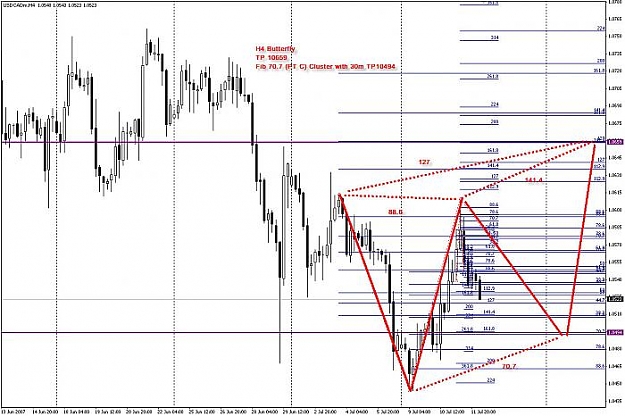
The 1.618 level you are asking about is the projection of the A to B leg, and the .618 is the retrace of the X to A leg.
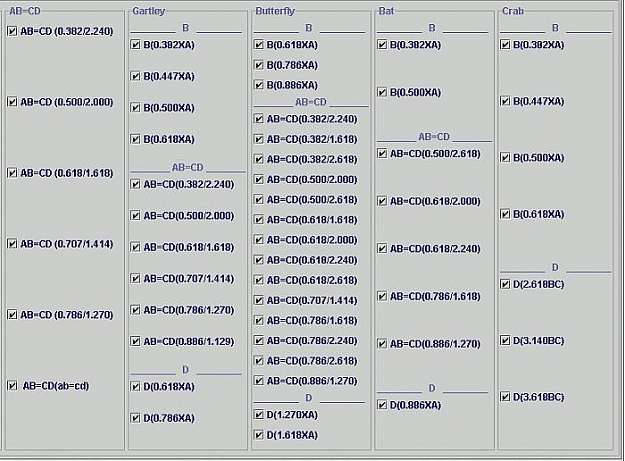
Please DO NOT try and trade these patterns unless you are very familiar with the Gartley patterns and the theory and logic behind them, these are my specific rules that I have come up with after extensive back and forward- testing. Consider this my disclaimer, LOL.
Pippiper