When I technically analyze markets, my starting point always begins with the highest timeframe. The highest TF defines the Primary trends. Within the Primary exists lesser trends based on secondary and intermediate timeframes. The ones I am concerned with are the following:
Yearly, Quarterly, Monthly, Weekly and Daily.
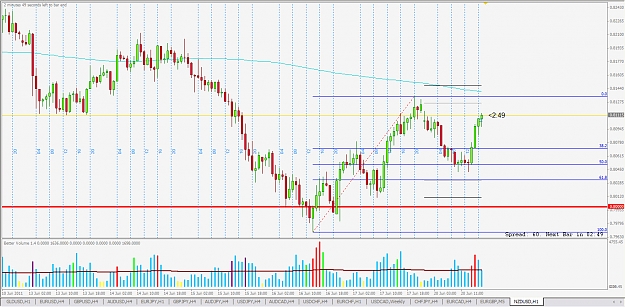
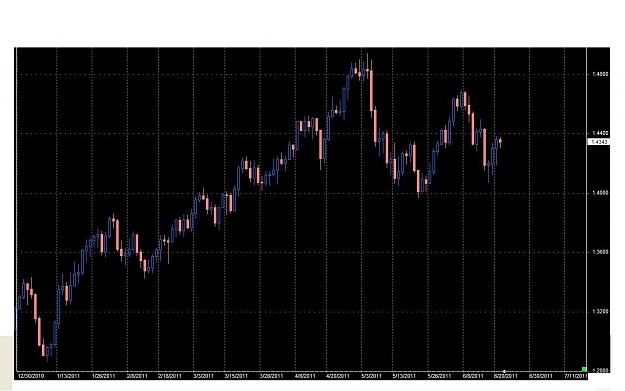
1- Looking at the EU monthly, it looks like this pair seems to be in a steady uptrend since 2000. If we look closer i.e. to the last three years, it has made 2 lower highs (one of which is possibly in the making as we speak) and 2 lower lows.
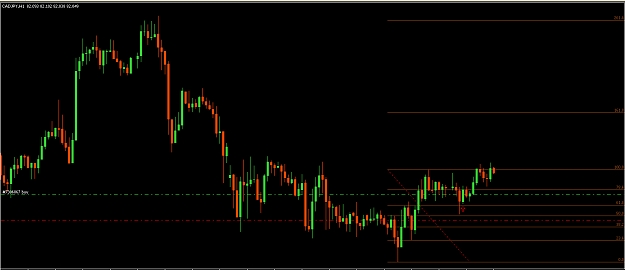
2- The daily shows that this quarter is doing a similar sequence as in 1 above.
3- The monthly has been clearly rejected from climbing higher (up until now) from an area very close to 1.5
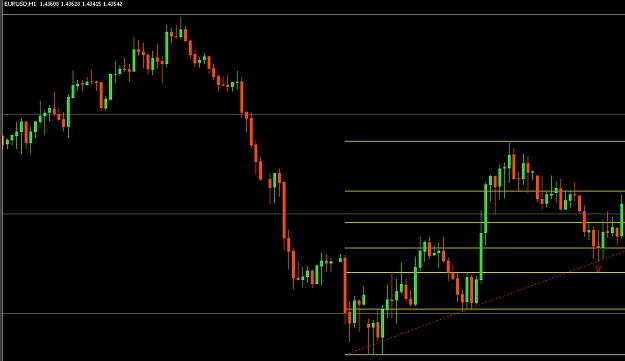
4- The weekly has a H-L-LH sequence but with a major breakout and bounce (retest of breakout) off the trendline extending from the high in 2008 down to the high in 2009.
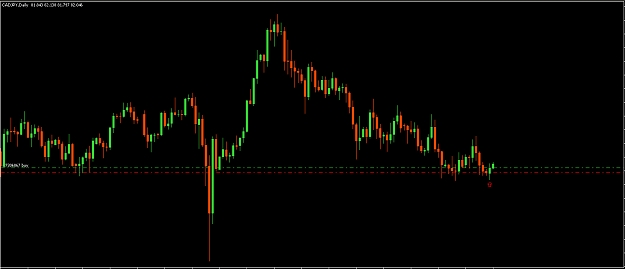
5- The daily has also a H-L-LH sequence
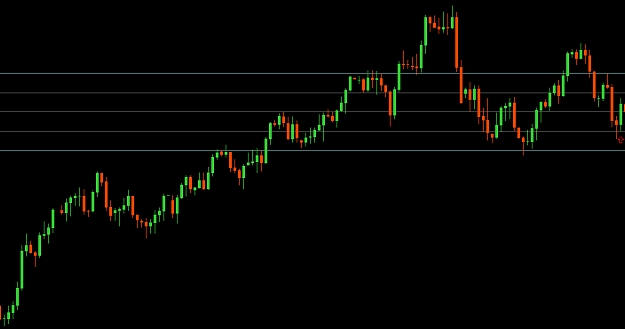
What we have discussed in this thread so far is all fine in terms of major line bounces/breaches and etc… but what I want to draw your attention to now is the fact that Primary trends always prevail in the long term. What I mean by that is, the low made in May 2011 is very significant to me. Normally, price will never go past a MAJOR TRENDLINE and or MAJOR LINE (not even for one pip) unless it has future intentions to resume that move. If we zoom in closer and look at that particular day in May, 23-05-2011, I see a very bold bearish candle that shows me its intentions i.e. opened just above that trenline and closed nicely below it.
I trade all trends; primary, secondary, intermediate and etc… The short positions I am currently in are either going to die on me with some profit or they will grow with the resumption of the down move. Am I in longs as well… sure I am… I have positions still open since January 2011. Do my stops get hit? Sure they do, that’s why they are there…
I did not take any longs today because I cannot just discount the bold bearish candles that were made so far this month. Before I don’t see clear bullish strength (specifically on D1), there are no longs for me.
Yearly, Quarterly, Monthly, Weekly and Daily.
1- Looking at the EU monthly, it looks like this pair seems to be in a steady uptrend since 2000. If we look closer i.e. to the last three years, it has made 2 lower highs (one of which is possibly in the making as we speak) and 2 lower lows.
2- The daily shows that this quarter is doing a similar sequence as in 1 above.
3- The monthly has been clearly rejected from climbing higher (up until now) from an area very close to 1.5
4- The weekly has a H-L-LH sequence but with a major breakout and bounce (retest of breakout) off the trendline extending from the high in 2008 down to the high in 2009.
5- The daily has also a H-L-LH sequence
What we have discussed in this thread so far is all fine in terms of major line bounces/breaches and etc… but what I want to draw your attention to now is the fact that Primary trends always prevail in the long term. What I mean by that is, the low made in May 2011 is very significant to me. Normally, price will never go past a MAJOR TRENDLINE and or MAJOR LINE (not even for one pip) unless it has future intentions to resume that move. If we zoom in closer and look at that particular day in May, 23-05-2011, I see a very bold bearish candle that shows me its intentions i.e. opened just above that trenline and closed nicely below it.
I trade all trends; primary, secondary, intermediate and etc… The short positions I am currently in are either going to die on me with some profit or they will grow with the resumption of the down move. Am I in longs as well… sure I am… I have positions still open since January 2011. Do my stops get hit? Sure they do, that’s why they are there…
I did not take any longs today because I cannot just discount the bold bearish candles that were made so far this month. Before I don’t see clear bullish strength (specifically on D1), there are no longs for me.