Joined Aug 2011
|
Status: All the world is a stage...
|857 Posts
Hi Kambooj ; I think we still are in the bearish trend. here is the chart which I am following for EURUSD with -22,5 and -45 and -67,5 degree lines on it . The trend will remain as bearish as long as it is below -45 degree line, and today it retraced back to the intersection of the 45 degree line and the circular resistence. So starting from these levels we must see a bearish trend in the following days. In case -45 degree line is broken , then this chart will be trash
Honestly ı was expecting 3380 this week , but it didnt happen :S When we look at the bigger picture , it seems that the bullish trend is not over yet , and the circular zone we are in had been a zone of chaos (black circle on the top-left) in the past. And it seems that it is still the same.
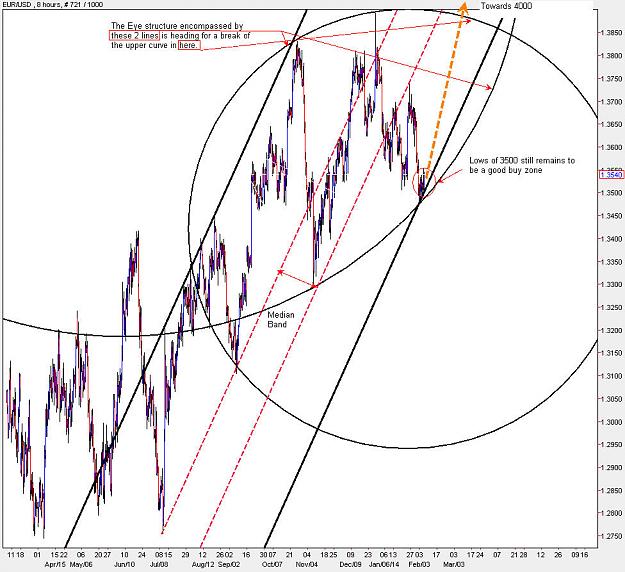
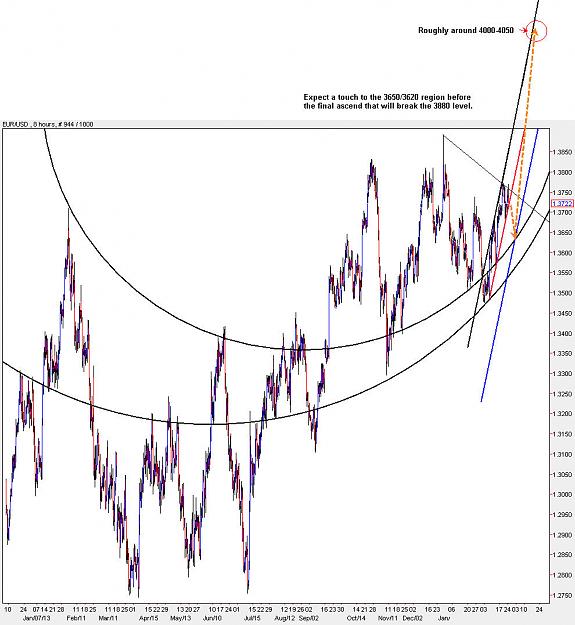
Despite the recent attempts to break through the 3650/3700 zone, several setbacks have occured, but all setbacks are pointing to a zone where the pair is looking to find a grip to surpass this level. Circle#1 will be the main crutch for the movement upwards. The most important zone in the picture below is the intersection of T1/T2/T3, which will serve an anchor for the motion to progress past 3650/3700 level. The first target, at a minimum is the 4000 level, because a pole break of the blue circle is the final aim for this pair.
3550-3650 remains to be a good buy zone for a target of 4000
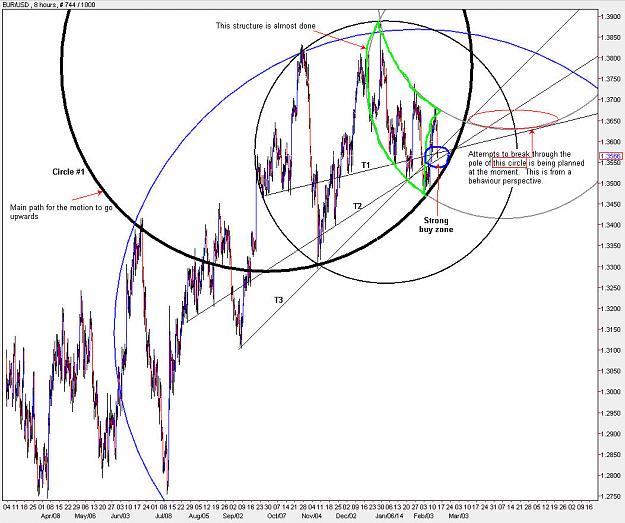
Every downward reversal requires a spike upwards first before it decideds to make its final plunge. In the case of EUR/USD we have not seen this happening yet. Its missing a spike on the weekly chart.
As price action gets closer and closer to the pole of a circle, it becomes more and more unstable, and it is this unstability that generates the momentum for it to go upwards and break through the pole.
During the past week we have seen large dips, but not a decision to revert price action. Right now it is in the wildest zones where false reversals continue to happen.
Once 3700/3750 gets broken, it gets closer to the pole on this time frame.
The next behaviour that will be witnessed is a quick surge to break the pole at 3900. So you most probably will see something like a 150 pip quick surge upwards in the coming days.
Right now the name of the game is to buy at every dip.
Joined Aug 2011
|
Status: All the world is a stage...
|857 Posts
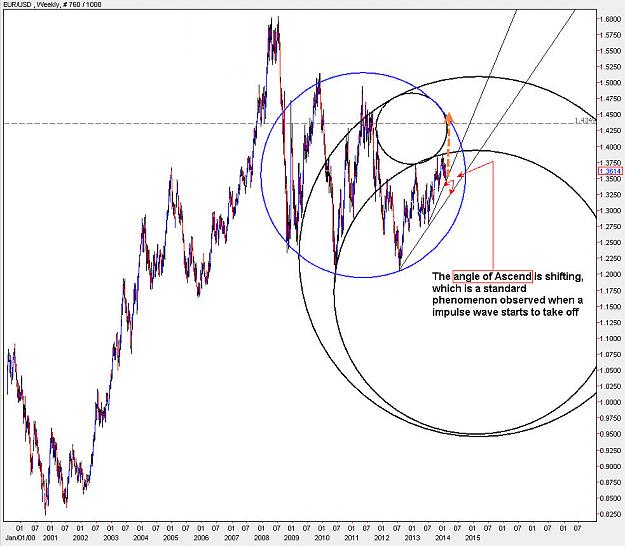
I was on the bearish side for a while until the invasion of 3685. And now I am again on the bullish side and I feel safer that your analysis also show the north. My weekly chart has an energy zone (magnet) around 4050s which is the intersection of the ascending trendline and the 1,618 circle.
On the other side I made some USDCHF chart-study and it is easy to see that the rice is on a bearish trend on the monthly basis , and the existence of the Head and Shoulders pattern make me believe that the circular support will be touched again in the close future (like 9-10 months).But honestly I expect an explosive bearish trend in the following two weeks.
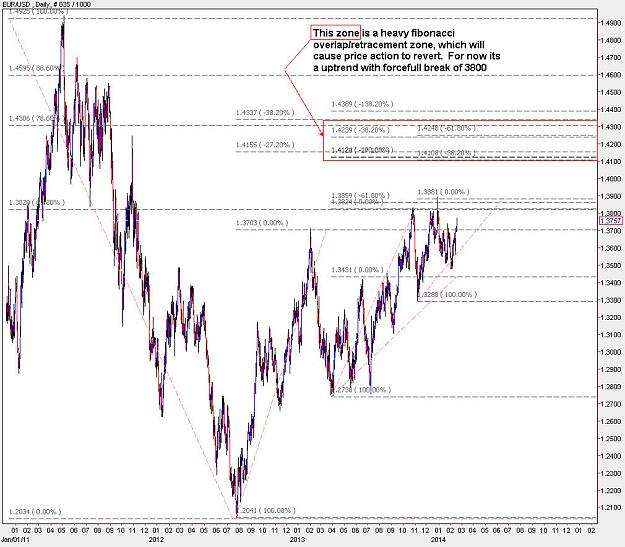
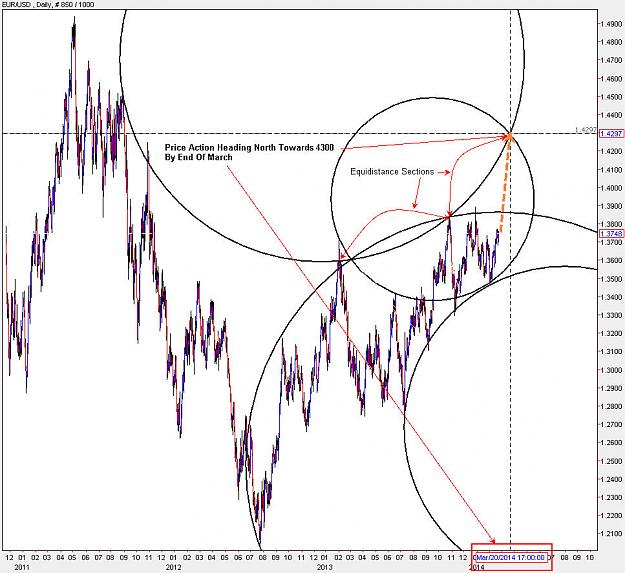
From the diagram below we can see that the zone between 4100 - 4300 is where a huge number of fibonacci retracements and price extensions are meeting. The 3800 zone was also a strong one, which means that since the intention right now is to break 3800, it will be quite forcefull. The 4100-4300 zone will be a sell zone for now, but until then buy at the dips.
I was on the bearish side for a while until the invasion of 3685. And now I am again on the bullish side and I feel safer that your analysis also show the north. My weekly chart has an energy zone (magnet) around 4050s which is the intersection of the ascending trendline and the 1,618 circle. {image} On the other side I made some USDCHF chart-study and it is easy to see that the rice is on a bearish trend on the monthly basis , and the existence of the Head and Shoulders pattern make me believe that the circular support will be touched again in...
Ignored
Thanks very much Selym for your kind posts, I dont know whether its 4050 or 4100, but its hard to gage at the moment until the break of 3800 happens. The momentum will tell the rest of the story.
|
Joined Dec 2011
|
Status: The Little Guy
|145 Posts
surprisingly 1.41 is what i am waiting for in order to short this beast. Its not too far-fetched too. +gbpusd is looking to make new highs before crashing again. All adds up.
EUR/USD Outlook Still Bullish even after a dip to the 3700 level yesterday. Here is the chart: {image}
Ignored
I am also waiting for that explosive bullish trend. And for that to happen (from my perspective) we need the red circle to be broken (daily chart), at least I accept that circular resistence as a bullish trend trigger. The intersection of the (weekly chart) trendline and the circular target (- +1 week) is between 10-28 February. And this week that target shud be reached. I will keep my longs until the end of this week. On the other side its easy to see the footprints of the bulls (weekly chart) . The confirmed inside bar formation makes me feel more comfortable about my longs.
{quote} I am also waiting for that explosive bullish trend. And for that to happen (from my perspective) we need the red circle to be broken (daily chart), at least I accept that circular resistence as a bullish trend trigger. The intersection of the (weekly chart) trendline and the circular target (- +1 week) is between 10-28 February. And this week that target shud be reached. I will keep my longs until the end of this week. On the other side its easy to see the footprints of the bulls (weekly chart) . The confirmed...
Ignored
The red circle will be broken with ease, because motion is targeting a "Off The Pole" zone which becomes weaker as time goes forward. The area where the red circle is on the daily chart is a weaker zone than the pole, and for that matter the chances of it getting broken are higher.
{quote} The red circle will be broken with ease, because motion is targeting a "Off The Pole" zone which becomes weaker as time goes forward. The area where the red circle is on the daily chart is a weaker zone than the pole, and for that matter the chances of it getting broken are higher.
Ignored
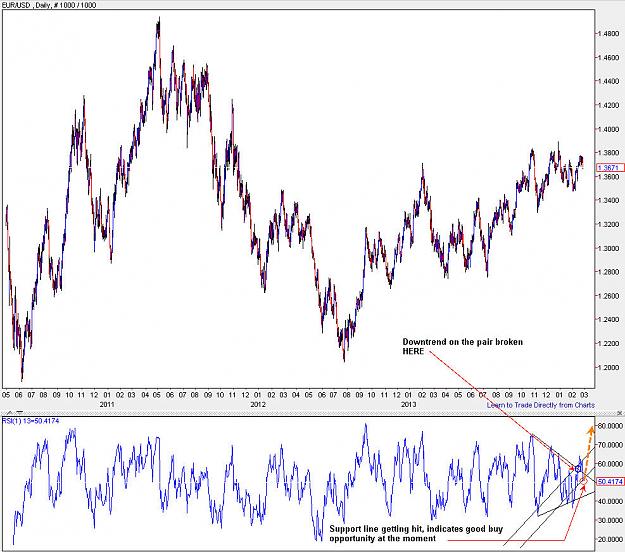
Violation of the red circle seems to show the strength of the bulls. But there must be a fundamental reason (trigger) for the expected trend. The question is : what will be the fundamental trigger which will motivate the bulls?
Whats your opinion about that? Do you think we need 3620s before the uptrend ?
{quote} Violation of the red circle seems to show the strength of the bulls. But there must be a fundamental reason (trigger) for the expected trend. The question is : what will be the fundamental trigger which will motivate the bulls? Whats your opinion about that? Do you think we need 3620s before the uptrend ? {image}
Ignored
I dont know about the fundamental trigger,
I guess it would be the frustration of the market in trying to sell off this pair, the market is looking for a higher high to dip from.
Since I believe in what moves the market is Fear and Excitement, then it probably the Excitement of going higher to see how hard we fall
The New Moon is on March 1st.
Usually the New Moon is a sell, but because we hanvent had a spike up, there wont be any major turnarounds, just a strong sell, which is also the characteristic of motion trying to break through the pole as I have indicated in previous daily charts. The sell will catapult the buy to break through the 3800/3900 barrier, and once its above that then 4000 and 4300 should be reached very quickly.
So what I highly suspect in the next couple of days is a dip to 3620 and then a rise to 3900.
Joined Aug 2011
|
Status: All the world is a stage...
|857 Posts
Gold really fits the golden ratio I just closed my 1293 long at 1341 because the price is about to reach the target circular resistence , and I just prefered to wait for another entry after a pullback ... XAUUSD is really a great pair which fits in harmonic perspective ...
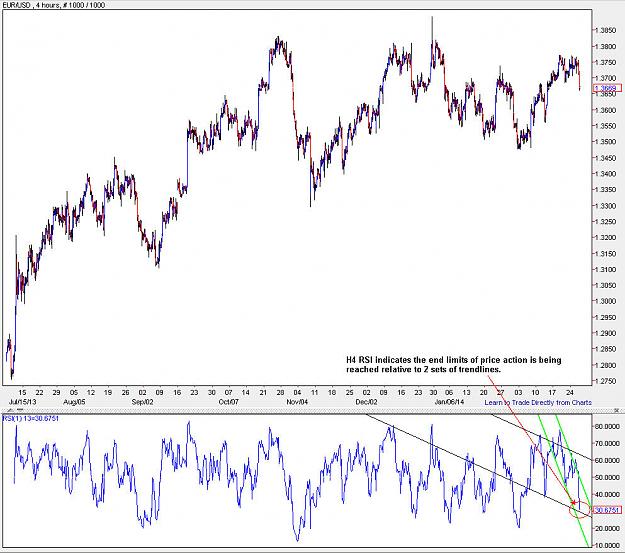
EUR/USD Outlook The RSI chart is showing good buy opportunity. Pair so far has reacted as expectation, with a strong thrust waiting to happen towards 3880/3900 zone. {image}