This is the second chart for USD/JPY to prove and confirm that the buy signal is stronger and we doubled checked that by looking at different time frames. Lets wait and see next week where will it take us
Hi Pipmaker- that's not a morning star. The signal should occur after a decline in price. On the daily, the doji just tells us there is indecision in the mkt. If anything it's more like an evening star i think.
This is third confirmation that makes buy signal stronger. There is a Doji candlestick right after the hammer.
Tell me what you think if you see something else that I don't see even if its a good or bad sign. Thanks
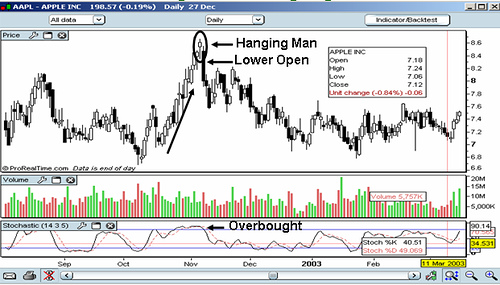
Not trying to pick faults,but that's not a hammer. It's called a hanging man. It's exactly the same, the only difference is whether it occurs in an uptrend or downtrend.
If price has fallen, it's a hammer.
If price has risen, it's a hanging man. It's a bearish signal, but you should wait for confirmation, with a lower close on the next candle, before trading it.
Also, candles are best traded with major support/resistance. You can see the signals all the time, but it's the location where they appear on the chart, that is important.
hope this helps...
Ignored
OK USD/JPY Resistance Level 2 at 81.40 Resistance Level 3 at 81.93 Current price 81.68
Dear jazzman let me tell you why I think that its a hammer but not a hanging man.
Hammer is found in a downtrend.
Hanging man is found in the uptrend.
Right now its a downtrend and Hammer is a sign of a potential reversal in the market.
Hammer is found in a downtrend. Hanging man is found in the uptrend.
Hi Pipmaker i totally agree with that.
Not that it matters, and don't want to clutter the thread up, but i was looking at the chart you posted, in post 9, the daily usdyen chart.
Thats a hanging man, not a hammer.
I tried to upload the Nison course to help people who are new to candles, but the files too big to upload as an attachment.
I don't agree with the other poster regarding names.
If people are discussing candles, it makes sense to use the correct terms, otherwise it will be confusing. The conventional names are not subjective at all. they are definitive.
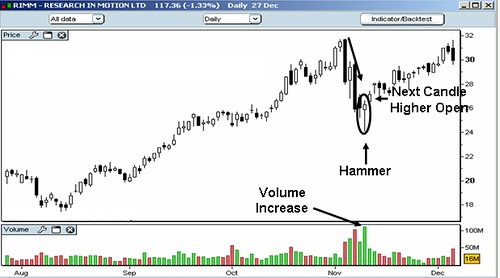
Brother, here is a picture that described where the hammer and where the hanging man is. enjoy Attachment Attachment
Ignored
You move fast between symbols and markets. I'm more used to understanding a symbol from the ground up, in some combo of technical and/or news. No wonder a stricter use of candles may work for you.
I know that 2 candlesticks of DOJI is a sign of potential reversal, but the ones on the chart do not look like DOJI, can DOJI look like the one candlesticks I circled on the chart?
I know that 2 candlesticks of DOJI is a sign of potential reversal, but the ones on the chart do not look like DOJI, can DOJI look like the one candlesticks I circled on the chart?Attachment
Ignored
Dojis by themselves, IMO, don't show a reversal. They show INDECISION. You need further confirmation before you can call it a reversal. Remember, these types of patterns simply show us what COULD be possible. We need confluence before we enter the trade.
I look for the following:
1. Nice signal, like a pin bar, engulfing bar, etc...
2. Check the overall trend. Try to stay with the big trend
3. Check if it is near a support or resistance line
4. Check the potential TP/SL based on the support or resistance
I need at least 1:1 risk to reward to enter the trade. If I don't have multiple signals telling me the trade is good, then I don't trade.
Yes you can join if you know anything or have success trading or predicting market using candlesticks please feel free to post charts and show us what you know
Dojis by themselves, IMO, don't show a reversal. They show INDECISION. You need further confirmation before you can call it a reversal. Remember, these types of patterns simply show us what COULD be possible. We need confluence before we enter the trade.
I look for the following:
1. Nice signal, like a pin bar, engulfing bar, etc...
2. Check the overall trend. Try to stay with the big trend
3. Check if it is near a support or resistance line
4. Check the potential TP/SL based on the support or resistance
I need at least 1:1 risk to reward...
Ignored
Well said, don't try to grab a sign of reversal at a wrong place.
Don't sell at support and don't buy at ressistance before it is broken, even better, act after a test.
And don't trade a flat market, that's where candlereading fails IMO.
Always, always, always wait for confirmation and for the close,
trade what you see not what you want.
I also use fibo extentions for target points in the current trend,
to spot exhaustion or reverse.
Keep this thread alive coz candlereading is major, next to candle pattern one of the best indicator.
In addition to what you mentioned, I personally like to use the gap analysis, which is helpful when projecting price targets.
An old Japanese trading adage goes, a dip and rally are absrobed into the window (gap). Surprisingly this still holds true even after centuries.
As the gap is hard to find in Forex (except Monday opening gap), please try identifying them in commodity and stock markets as the gap is usually filled before the price movement changes its direction, which is so mysterious as the Fibonacci.
Ignored
Hmm, could you clarify what you've just said with a picture?
only thing i know about gaps is they could indicate a reverse,
when the gap is filled and don't push further. that's the reverse-test sign.
but this fails very often, i've tested this, used an indicator to spot these little gaps easily, so i quickly saw the fail ratio is very high so imo very useless. ..
But, like i've said maybe u could post an example, maybe i understood you wrong.
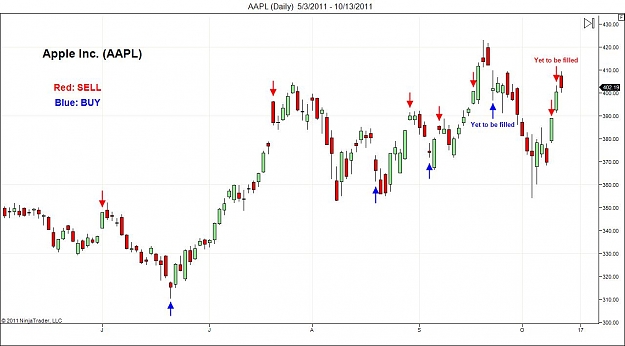
Here is the recent chart of the second largest company in the world in terms of market cap.
Currenly the three outstanding gaps established on the dates below are waiting for being filled.
9/23/2011
10/11/2011
10/12/2011
Just fade toward the direction where the window was opened, which must be one of the easiest strategies to implement.
Please make sure that knowing a dip and rally are absorbed into the window we can get a clue to the potential retracement/target levels.