Mark I was wondering if this was a valid FB set up on NZD/U in your opinion (which has just played out and was a loss). Break of H1 SR (admittedly not overly concise) into overlying supply (admittedly not that well-defined). Reasonably strong rejection and close back below the SR. There is momentum into the breakout but after the initial rejection (potential supply consumption) the second two-bar rejection convinced me price was struggling to go higher and it was worth a short trade. As you can see, it didn't work out but was it a poor-odds setup...
Ignored
It's actually one that was discussed with members earlier - it's too impulsive a move - there is just too high a chance of the rejection being supply consumption than true rejection.
The FLS would have been that SR you've marked on the M15 chart too - we can't hope price will get over clear hurdles we have to let the PA tell us whether we expect this to happen and in this case a) the FB was not a good one and b) there was little space.
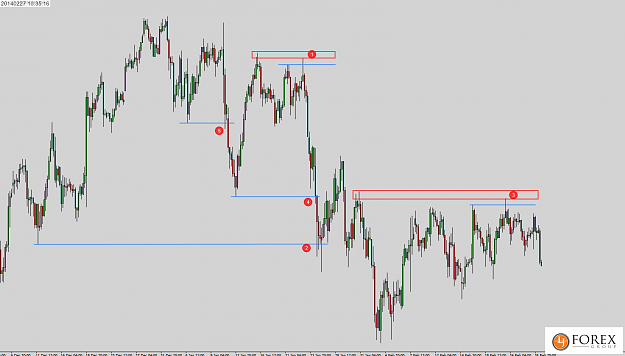
Below is a chart I shared earlier of H4 USDJPY to compare good versus poor FB setups.
1 and 3 are the ones you want to look out for whilst avoiding 2,4,5.
Remember that we want to look for:
Material FB's of clear swing points / SR's.
Clear rejection within the FB.
Sideways moving price action i.e. not strong impulsive / trending moves.
Clear space for price to move into.
1 and 3 meet all of these attributes, whereas:
2 is a very strong move into the FB.
4 is a strong move again, small FB and small rejection.
5 is very similar to 4.
Thus for those three there is too much uncertainty as to whether the rejection is just demand consumption paving the way for a move lower or a sign of true rejection and a move higher. In fact for 4 and 5 you can say that price is more likely to move lower than higher after those FB's form.
Although the NZDUSD H1 FB wasn't as clear cut as those three above, it still looks too impulsive versus the rejection strength behind the FB - there is enough uncertainty there to pass on the setup for me.
You have to be careful with FB's, not getting sucked into FB's that don't fully meet the attributes above.
PS pity you won't be posting some of your lower timeframe trades anymore. They were very educational. Hope you reconsider! Huk
Ignored
Preferred to just keep the FF thread as a central resource for the website strategies than go over PA trades, which are more advanced and can be confusing when most are trying to learn the basics of the free strategies first.
I am posting PA trades (though not the last couple days as been busy) on my new twitter account though.
{quote} It's actually one that was discussed with members earlier - it's too impulsive a move - there is just too high a chance of the rejection being supply consumption than true rejection. The FLS would have been that SR you've marked on the M15 chart too - we can't hope price will get over clear hurdles we have to let the PA tell us whether we expect this to happen and in this case a) the FB was not a good one and b) there was little space. Below is a chart I shared earlier of H4 USDJPY to compare good versus poor FB setups. 1 and 3 are the ones...
Ignored
Thanks for the detailed response. I realised it was less than perfect and I understand what I'm supposed to be looking for. The trick is spotting them in time and not clutching at the setups that look a bit dodgy! Looks like I'll be a twitter follower (which is a first for me!).
I'm now following you on Twitter for your VLTF PA posts. I have some questions: answer or pass on any of them as you wish.
You've said on this thread that you no longer think in terms of "R" on the VLTF: is this because you're using a set SL distance and fixed lot size? Do you vary the SL distance and adjust lot size depending on the set up: if so, is that done on the fly?
Are you entering these trades at market (perhaps using an MT4 script to drop on the chart or something similar) or are you using limit orders for retraces and perhaps even stop orders for BO trades with predetermined SL/lot size?
I know you follow U/J and E/U....any others? If you also follow other pairs from time to time, how do you determine which pair(s) will be on your radar in a given trading session? Do you follow them all at the same time or do you find E/U is more a morning pair and then you switch your focus to U/J in the afternoon, for instance?
In your experience what are the best hours for trading the VLTF charts?
I still struggle/am trying to work out a good routine to my day (my employment was terminated a couple of months ago so I have time to push my trading forward). Would appreciate any tips you have in that regards (I realise that's a wide topic).
{quote} It's actually one that was discussed with members earlier - it's too impulsive a move - there is just too high a chance of the rejection being supply consumption than true rejection. The FLS would have been that SR you've marked on the M15 chart too - we can't hope price will get over clear hurdles we have to let the PA tell us whether we expect this to happen and in this case a) the FB was not a good one and b) there was little space. Below is a chart I shared earlier of H4 USDJPY to compare good versus poor FB setups. 1 and 3 are the ones...
Ignored
This is an excellent post, as is all the material on your website - thank you for sharing!
|
Commercial Member
|
Joined Feb 2008
|4,633 Posts
Quote
Disliked
You've said on this thread that you no longer think in terms of "R" on the VLTF: is this because you're using a set SL distance and fixed lot size? Do you vary the SL distance and adjust lot size depending on the set up: if so, is that done on the fly?
I don't think of R when trading with a fixed lot size (based on my average SL for each trade being x pips). In a scenario like this I would measure trades in pips rather than R as it is much more logical.
For reference I was using fixed SL size of 2.5 pips.
I did this for a while when I was focussing on USDJPY trading but found I preferred variable lot size based on fixed % risk instead - when of course R is the right metric to use when measuring performance of trades.
Quote
Disliked
Are you entering these trades at market (perhaps using an MT4 script to drop on the chart or something similar) or are you using limit orders for retraces and perhaps even stop orders for BO trades with predetermined SL/lot size?
Where possible I enter trades via limit orders due to the increased security this provides (i.e. no negative slippage compared to market or stops orders).
I use the Easy Order MT4 script for placing orders quickly.
Quote
Disliked
I know you follow U/J and E/U....any others? If you also follow other pairs from time to time, how do you determine which pair(s) will be on your radar in a given trading session? Do you follow them all at the same time or do you find E/U is more a morning pair and then you switch your focus to U/J in the afternoon, for instance?
I tend to change my 'approach' to trading every 4-6 months or so as for me boredom and lack of a challenge becomes a problem, so I overcome this by changing what I trade.
For a while I was focussing on just trading USDJPY using anything from M2-Daily as a HTF 'reference' TF to determine 'momentum directional bias' and the M1-M5 for PA for entry and SL (all my PA trading involves a HTF setup and a lower TF entry/SL to maximise R etc).
Of course being an intraday trader most of my traders we based around M2-M15 as my HTF reference.
Recently I made the change to not focussing on just one pair and focussing on more pairs but using higher TF's as reference TF's.
So now I focus on 6 FX pairs (EU, GU, AU, EG, AJ, UJ) and my higher TF's are H1, H4, Daily and Weekly using a TF sub H1 for entry/SL.
I apply the same approach as I did when trading USDJPY just across more pairs on higher TF's etc.
Quote
Disliked
In your experience what are the best hours for trading the VLTF charts?
Personally for intraday trading I prefer the European morning session over the NY morning session - I find setups are more common place and the market is less disturbed by scheduled news events (as market tends to 'wait' for news events and has a period of digesting and reacting post news events).
Quote
Disliked
I still struggle/am trying to work out a good routine to my day (my employment was terminated a couple of months ago so I have time to push my trading forward). Would appreciate any tips you have in that regards (I realise that's a wide topic). Thanks Huk
I think one of the biggest challenges is deciding on what to focus on - 1 pair, a fixed handfull of pairs, pairs that are off interest based on a morning review of HTF's etc.
A big part of that is looking at your personality, your strengths and working out what is the best fit.
If you struggle to watch for long periods and maintain high levels of discipline and concentration for example then focussing on 1 pair using M5,-M15 TF's isn't likely to be suitable, where as if you prefer to trade over a short time period (say 3-4 hours) then 1 pair and VLTF's might be more suitable etc.
Thanks for the detailed reply. These kind of insights are really valuable and helpful to me. My current approach is to follow 10 pairs looking for FTBs on a live account. I've also recently started "trading" two or three pairs on the VLTF to gain experience more quickly but this time on a demo account where I can afford to make mistakes. I find the only problem with demo is that I sometimes throw all my knowledge out the window and enter a trade for entertainment, which I instantly regret. I realise I need to treat the demo account as seriously as I would a live account otherwise I'll never build the tangible track record and confidence to put some meaningful risk in play. If I could only stick to those trades that conform to the plan I'd be doing quite well! I'm slowly improving in this regard though.
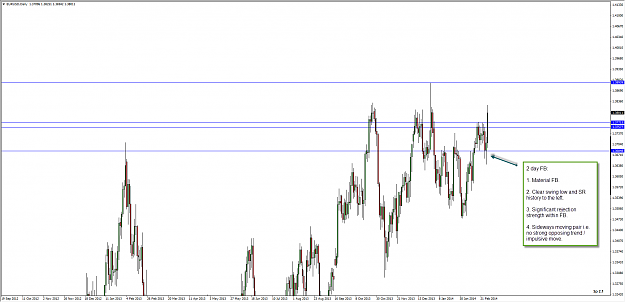
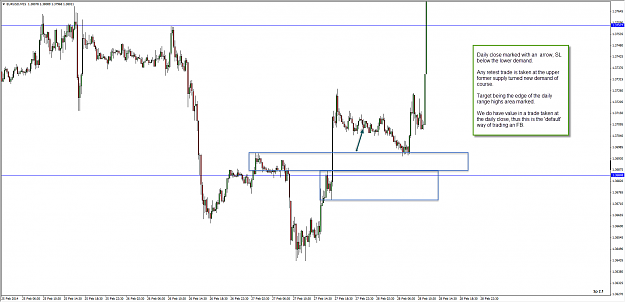
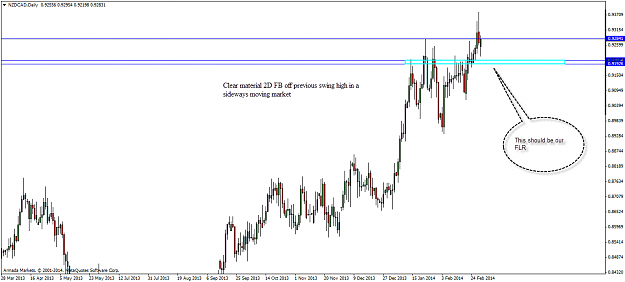
Mark how about this FB on daily ? It is a clear material rejection bar from a swing high in a sideways market. However I propably determined bad target as it turned against me. Could you please comment my charts? My biggest issue always with that FB´s is to recognize FLR/FLR.
Mark how about this FB on daily ? It is a clear material rejection bar from a swing high in a sideways market. However I propably determined bad target as it turned against me. Could you please comment my charts? My biggest issue always with that FB´s is to recognize FLR/FLR. Thank you {image} {image} {image}
Ignored
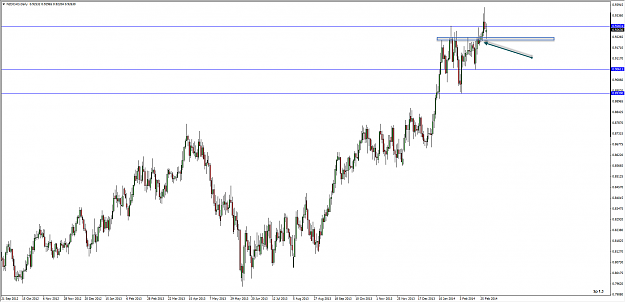
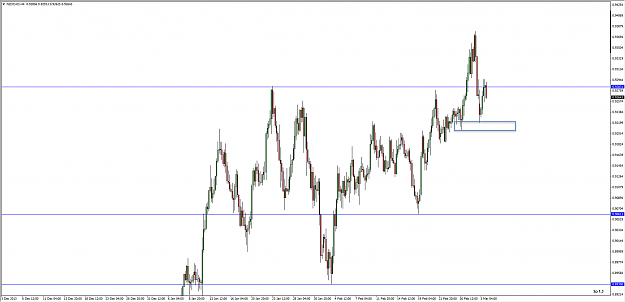
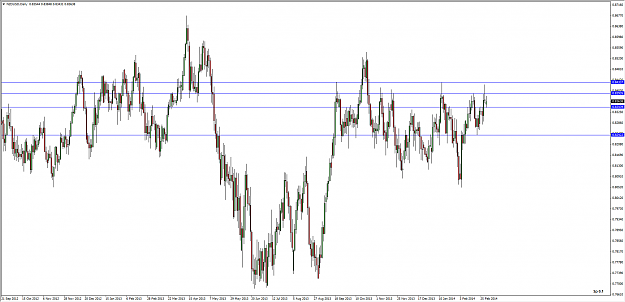
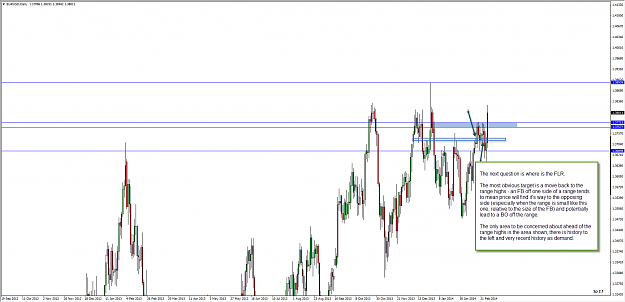
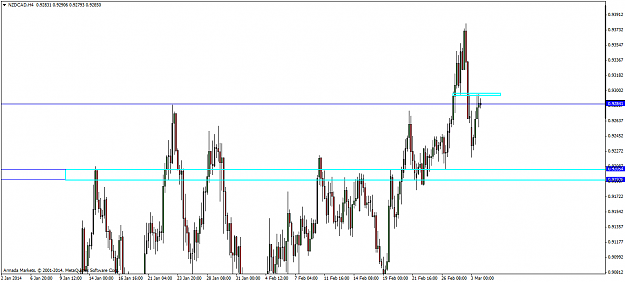
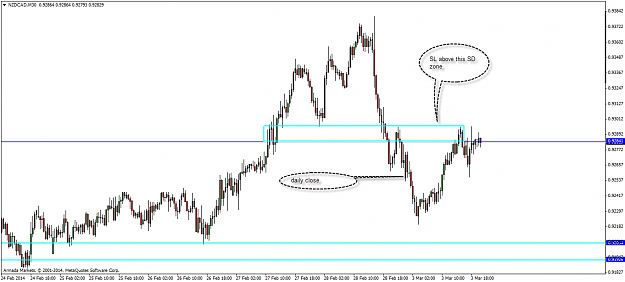
The FB is fine, but picking the target is not the easiest as it's a messy area.
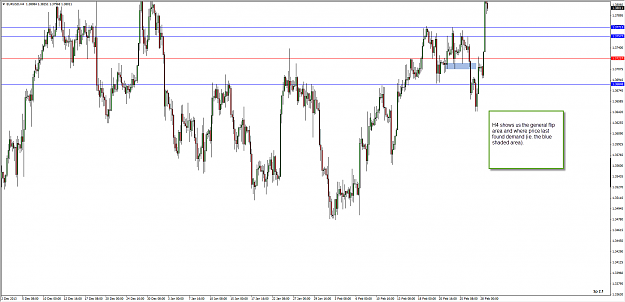
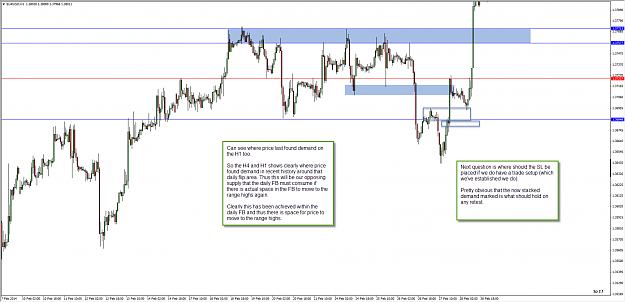
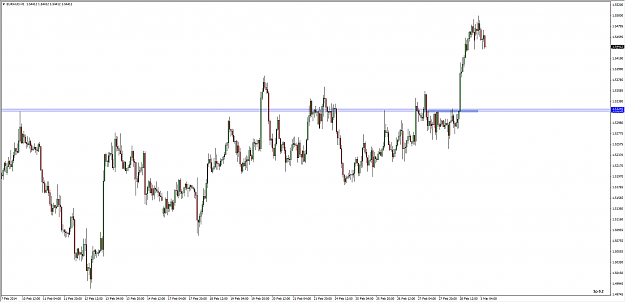
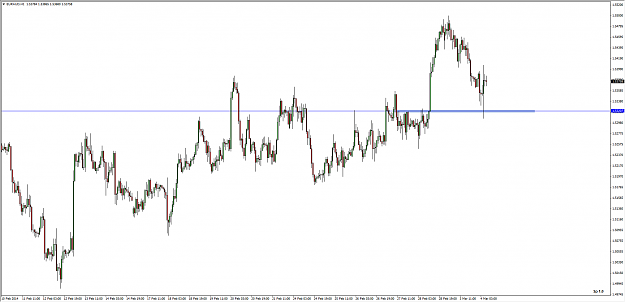
I'd be marking the daily area of interest for the FLS as per the charts below, it should be pretty clear that what we're looking for as a target is the source of demand that lead to the move above the highs, this is clear on H4.
However, I'd much rather have traded NU over NCAD - much easier to spot the target.
|
Commercial Member
|
Joined Feb 2008
|4,633 Posts
Couple pre-planned FTB's that triggered during RBA last night (so orders cancelled) - but useful to post for others to see the type of setups I am looking for.
|
Commercial Member
|
Joined Feb 2008
|4,633 Posts
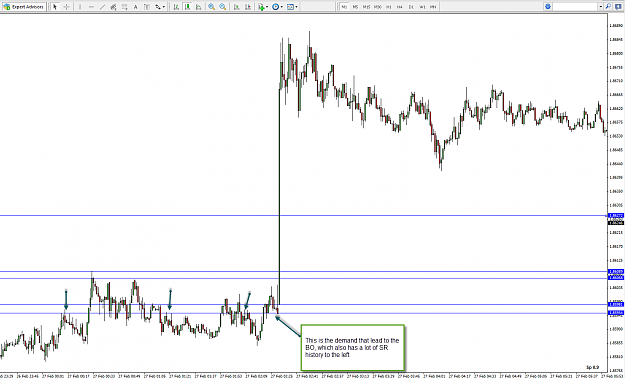
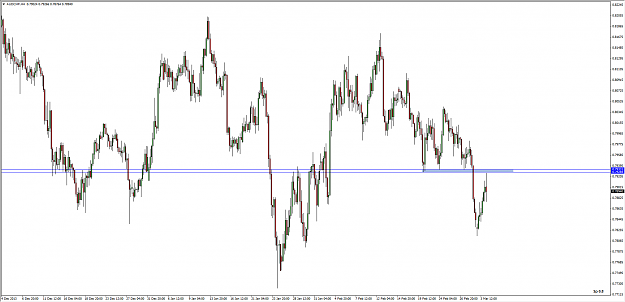
Analysis of a H1 FB on NZDUSD from earlier today with a member:
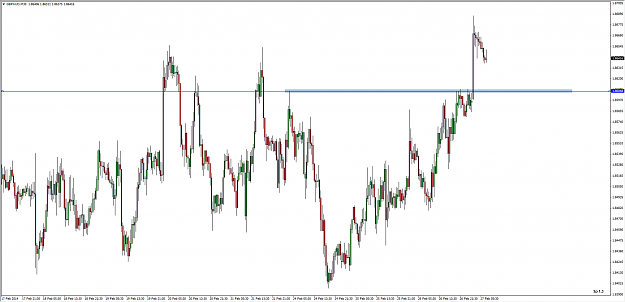
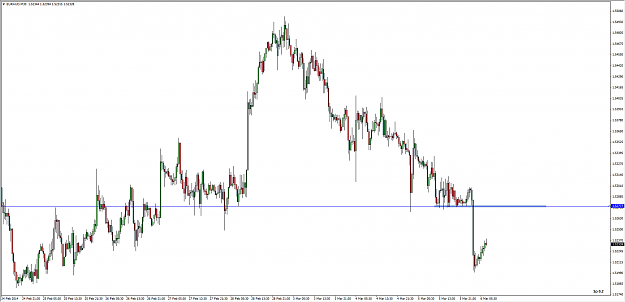
Chart 1:
Small FB of the swing high at (3).
Overall sideways moving PA within (2) but the last move into the swing at (3) was rather strong.
Potential for demand that lead to the break above all those lower highs and (3) to be within (1) - too hard to see on H1, need to scroll down a TF or two to reveal more information.
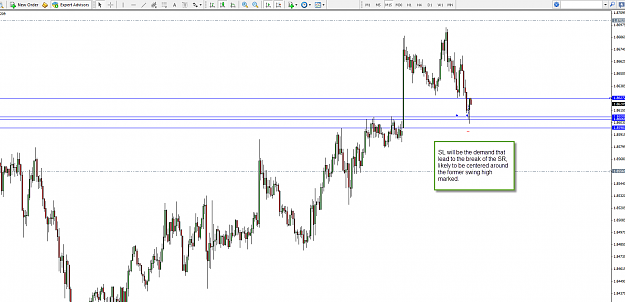
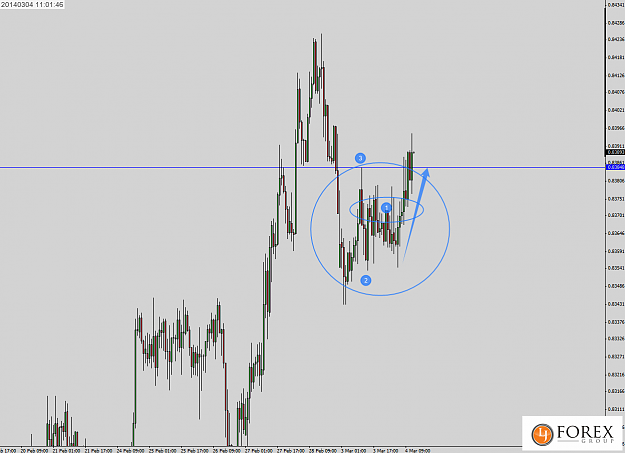
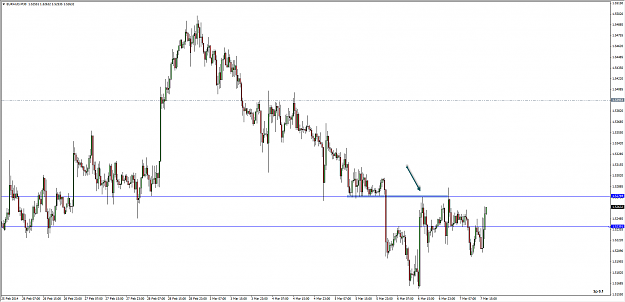
Chart 2:
M15 chart - can clearly see the demand that lead to to the break of the the highs circled is at (1) - thus the FB is merely price moving back to demand and thus there is no space.
Combine this with the actual FB itself (small FB combined with strong move into the break) and it's not a good setup.
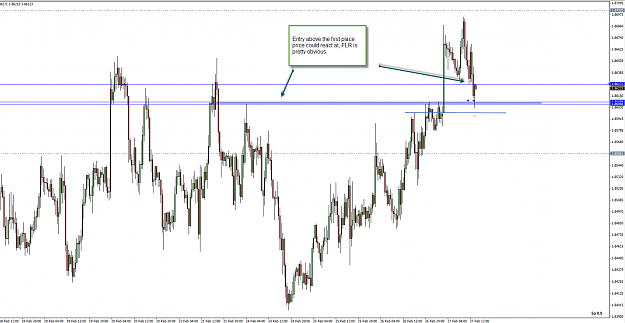
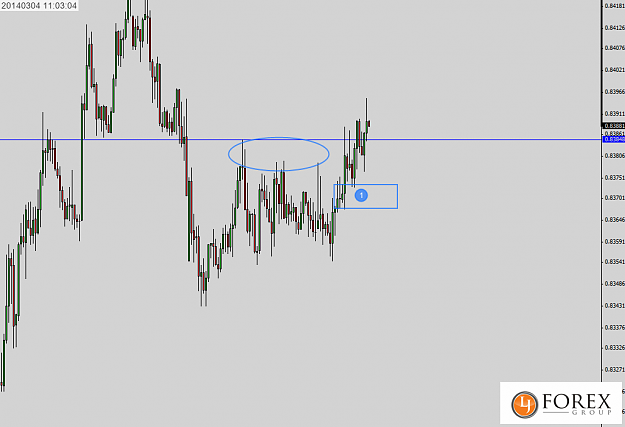
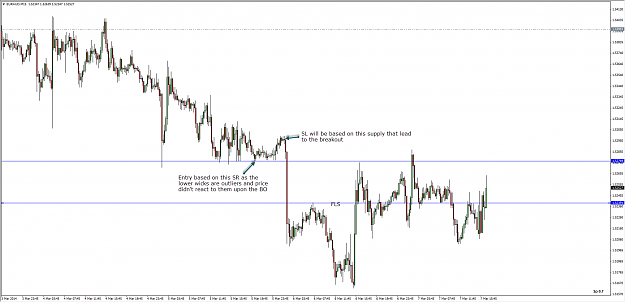
Chart 3:
Comparison of today's potential FB with one to the left.
The one to the left is a more material FB with no strong move into the break i.e. from a distance.
Price closed below the opposing demand that lead to the break of the highs and thus there was space for price to move with momentum to the next area marked.
{quote} The FB is fine, but picking the target is not the easiest as it's a messy area. I'd be marking the daily area of interest for the FLS as per the charts below, it should be pretty clear that what we're looking for as a target is the source of demand that lead to the move above the highs, this is clear on H4. However, I'd much rather have traded NU over NCAD - much easier to spot the target. {image} {image} {image}
Ignored
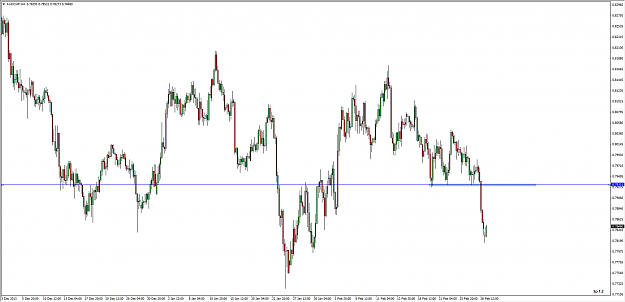
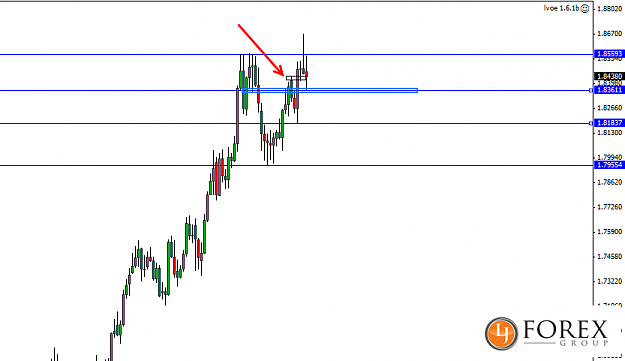
Thanks Mark, makes sense. I wanted to take that NZDUSD but price gapped down. How do you recognize if the SD zone is strong and it is our FLR/FLS? Do you have any criteria ? For example recent FB which you showed here, how did you know that the flip marked on chart below is not important ?
{quote} Thanks Mark, makes sense. I wanted to take that NZDUSD but price gapped down. How do you recognize if the SD zone is strong and it is our FLR/FLS? Do you have any criteria ? For example recent FB which you showed here, how did you know that the flip marked on chart below is not important ? Thank you for your explanation {image}
Ignored
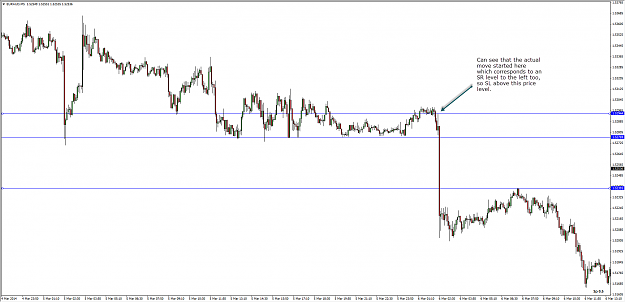
Focus on clear SD zones or SR zones that have history.
An FB is powerful price action in terms of the order-flow generated.
The area you marked is a former swing high which was tested post breakout, but it's not a clear new demand or SR and thus any good FB setup there really should not have trouble with that and should reach the clearer SR lower down.
|
Commercial Member
|
Joined Feb 2008
|4,633 Posts
In light of my recent decision to make sure this thread is solely dedicated to trading FTB's , FB's and DRT's I've opened up a new thread to share some PA trades / discussion.