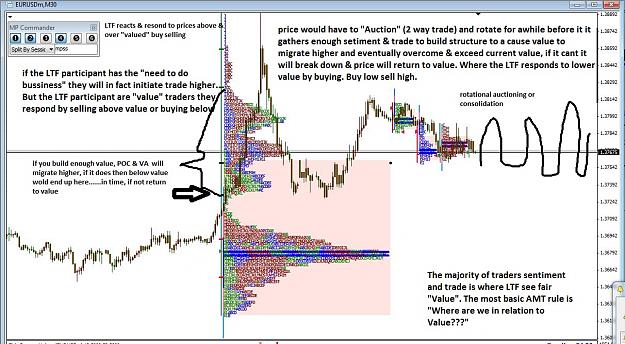
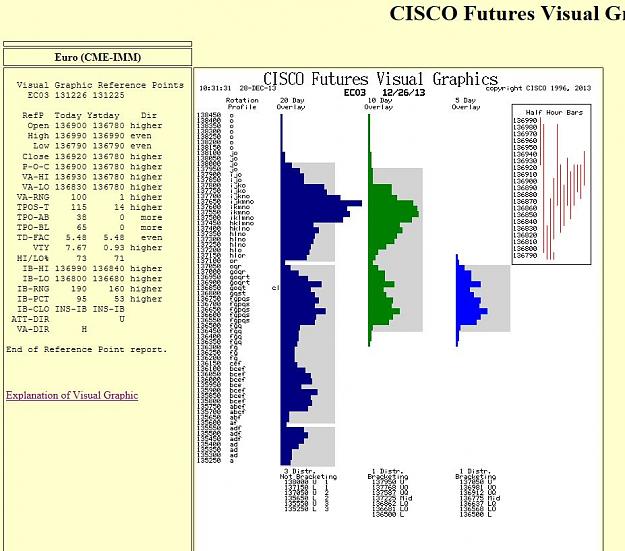
Let’s see what I can glean from Eur/Usd
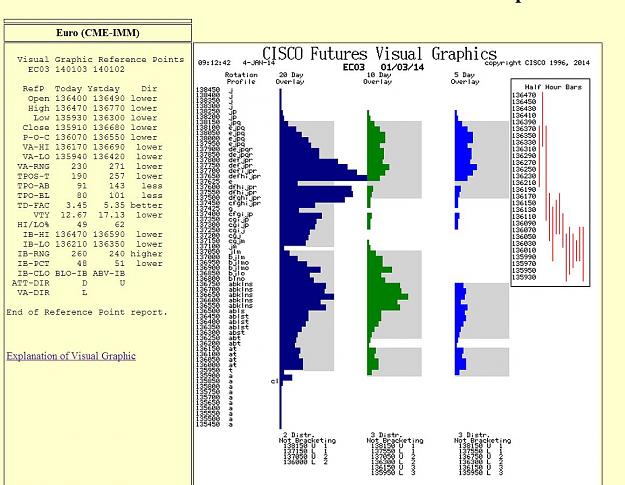
Relative to thurs increased prices, tpo count & tic count both increased, those 3 references imply increased activity, suggests change
We had both range extension both above & below the IB, which argues for congestion, no directionality. Also we had a widening VA, which argues for congestion
If we had evidence of both a buying tail & selling tail, that would be evidence of a “completed” auction. However, we have only a selling tail (“upside shut off” of buying) which implies ‘”selling pressure”. (from the looks of it, a major fact).
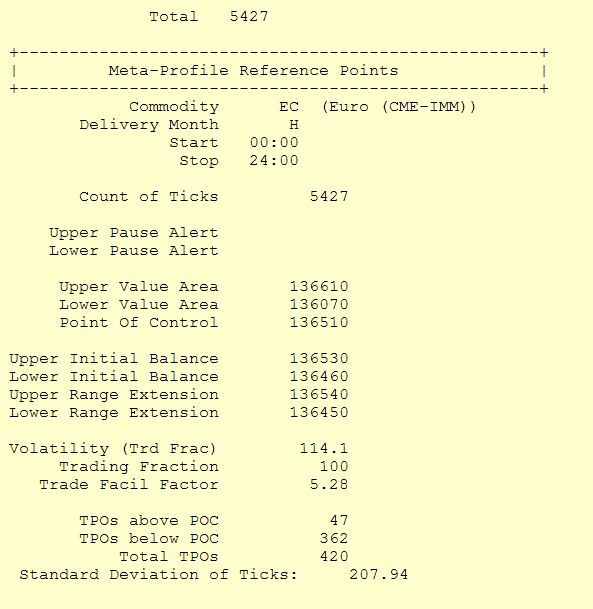
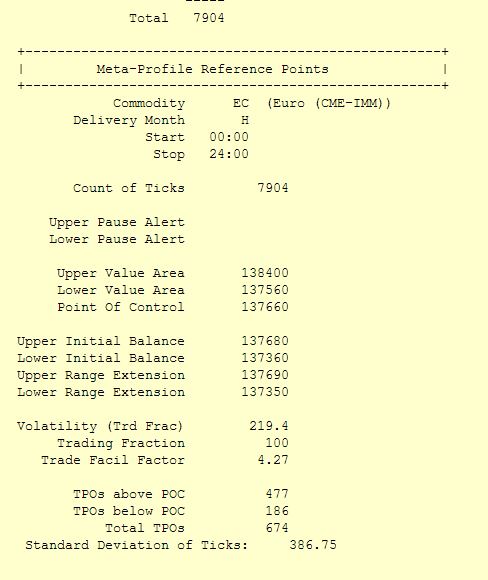
We also have a tpo count of 750 above the POC & 150 below the POC. There is a huge imbalance to the downside in the favor of sellers, so you would expect to see more trading below.
The POC is slightly higher, a stable POC implies little change in value, POC is higher but very weakly so. However, if you're familiar with the auction process & the LTF participant, “true value” cannot be determine from the intraday day TF. IMO from a LTF perspective, I don’t think value has change. On the surface, the flurry of activity, suggests higher prices (remember price is just an “advertizing mechanism”), but the internals imo suggests otherwise.
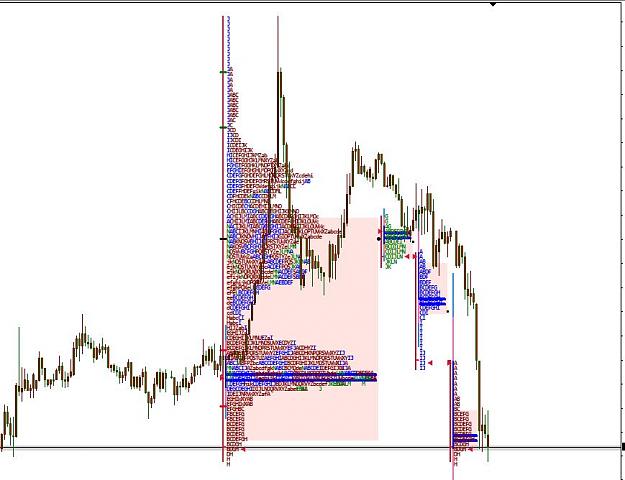
IB% decreased implies increase in “public control”, TPOs above & below the IB POC, is skewed to the downside.
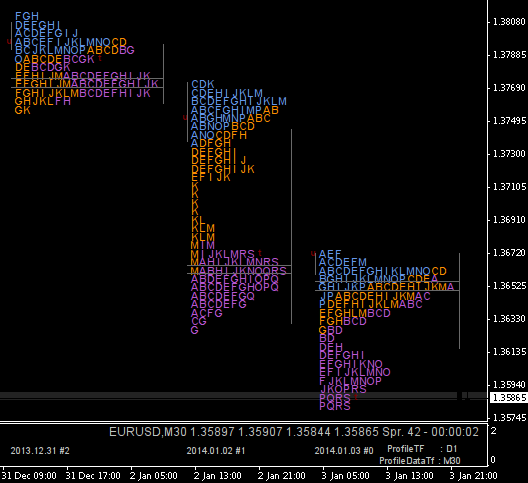
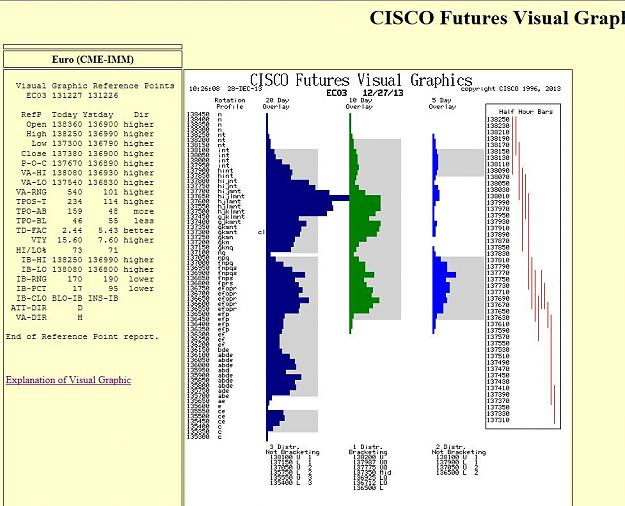
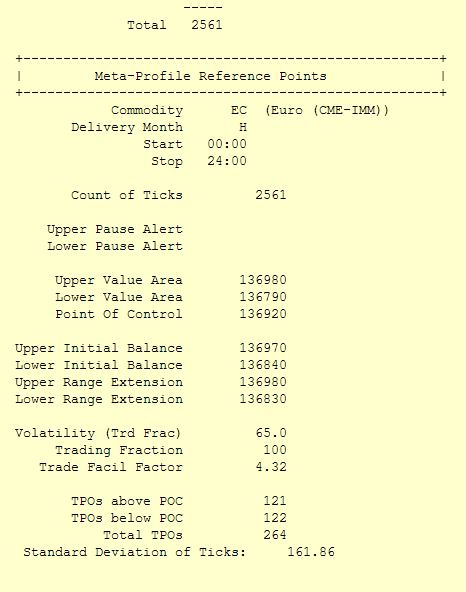
The biggest anomaly to me is TFF, until Friday we’ve been in somewhat of a 50-70 range with Thurs’s TFF of 4.32 (Tff = How well are we facilitating trade?) similar to previous days this week. Now after Friday’s crazy price action, the TFF is 4.27, pretty much the same, the internals & TFF suggest we haven’t facilitated any more trade than we’ve had all week. We’ve also formed a 10 day bracket, from analysis I did a couple of weeks ago, a thought there was a minor pause in the LTF trend. Now with the 10 day distribution in a bracket. Its still may be a pause in the LTF trend, but it’s possible this may be one of a few signs of the ending of the LTF trend. But this anomaly in the data brings to mind this scenario:
Capping by commercials fits this scenario:
1. Members want balanced market (commercial members)
2. Public drives price out of balance
3. Commercials call the office--cash traders
say nothing is happening in the cash market (FOREX)
4. Commercials wait for public to use up all
their (buying/selling) power
5. Trend stalls
6. Commercials pounce, drive market back to balance
7. Markets recover from commercial pounding in about 4 hours
Any way just my opinion of Fridays price action…….. Superficially, things look to the upside but imho, “internally” I don’t think anything’s changed "Relative" to the intraday TF
Relative to thurs increased prices, tpo count & tic count both increased, those 3 references imply increased activity, suggests change
We had both range extension both above & below the IB, which argues for congestion, no directionality. Also we had a widening VA, which argues for congestion
If we had evidence of both a buying tail & selling tail, that would be evidence of a “completed” auction. However, we have only a selling tail (“upside shut off” of buying) which implies ‘”selling pressure”. (from the looks of it, a major fact).
We also have a tpo count of 750 above the POC & 150 below the POC. There is a huge imbalance to the downside in the favor of sellers, so you would expect to see more trading below.
The POC is slightly higher, a stable POC implies little change in value, POC is higher but very weakly so. However, if you're familiar with the auction process & the LTF participant, “true value” cannot be determine from the intraday day TF. IMO from a LTF perspective, I don’t think value has change. On the surface, the flurry of activity, suggests higher prices (remember price is just an “advertizing mechanism”), but the internals imo suggests otherwise.
IB% decreased implies increase in “public control”, TPOs above & below the IB POC, is skewed to the downside.
The biggest anomaly to me is TFF, until Friday we’ve been in somewhat of a 50-70 range with Thurs’s TFF of 4.32 (Tff = How well are we facilitating trade?) similar to previous days this week. Now after Friday’s crazy price action, the TFF is 4.27, pretty much the same, the internals & TFF suggest we haven’t facilitated any more trade than we’ve had all week. We’ve also formed a 10 day bracket, from analysis I did a couple of weeks ago, a thought there was a minor pause in the LTF trend. Now with the 10 day distribution in a bracket. Its still may be a pause in the LTF trend, but it’s possible this may be one of a few signs of the ending of the LTF trend. But this anomaly in the data brings to mind this scenario:
Capping by commercials fits this scenario:
1. Members want balanced market (commercial members)
2. Public drives price out of balance
3. Commercials call the office--cash traders
say nothing is happening in the cash market (FOREX)
4. Commercials wait for public to use up all
their (buying/selling) power
5. Trend stalls
6. Commercials pounce, drive market back to balance
7. Markets recover from commercial pounding in about 4 hours
Any way just my opinion of Fridays price action…….. Superficially, things look to the upside but imho, “internally” I don’t think anything’s changed "Relative" to the intraday TF
Attached Image(s) (click to enlarge)
Attached Images
Markets are not efficient, rather they are effective - Jones