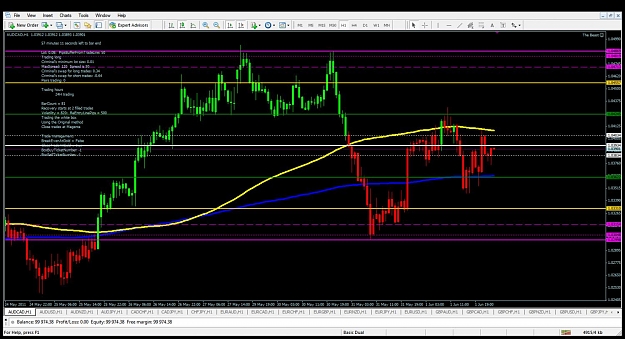
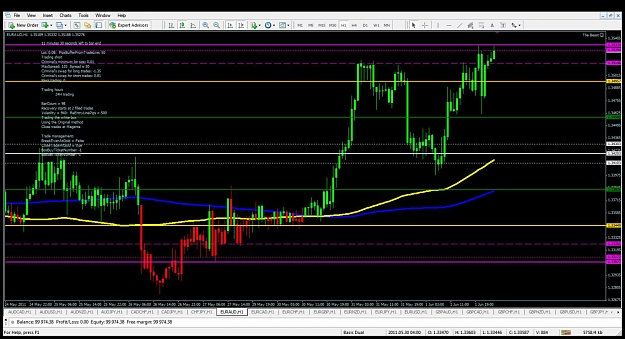
I have been reading a book about a simple way to trade with emphasis on the 100 and 200 moving average. These are universally respected averages every body looks at. Basically anything north of the 100 is bullish movement and south of it is bearish movement. When price encounters the 100 it will either tear through,bounce or range. Price can also stall at the 200 or pass through for confirmation of trend. So I started studying the white box and beast based on the 100 average. Then I set CCI candles on the chart. The CCI is set at a 100 period. So that every time price crosses the 100 moving average the candles now change color. If you look now at the chart you can see clearly when you want a box trade say long lime or red short. Now I have the filter set to 0 for emphasis but it could be set to anything that seemed most practical. -100 or 100 for instance. So a CCI set up like this could be programed in as a filter and you got the making of a filter that could reduce draw down. This could be static like the picture or possibly dynamic like what chaserl did for the bar counts. I am learning to code this stuff but months from understanding how to do this.
Doug
Doug
Attached Image (click to enlarge)