EDIT, - I do not use this STR by myself
The method is very simple and is based on an idea that a range can`t last for ever and it will need to break out at some point with no doubt.
The bars I use here is seen on this thread http://www.forexfactory.com/showthread.php?t=205471which is initiated of Zebulon. I don`t know who has found the idea to drow those bars but I first saw them in this thread and I thank to all participants of it and especially Zebulon.
Lets move on.
We will not need any indicators here and you can just draw those bars manually using rectangles. But there is an indi to do it for you in the second post.Also an indi ploting the horisontal lines on the chart and my template.
Rules
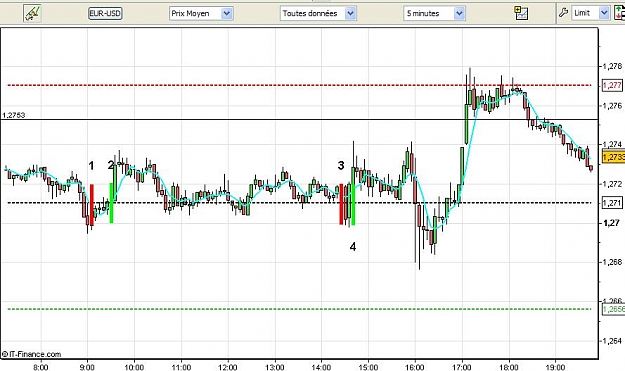
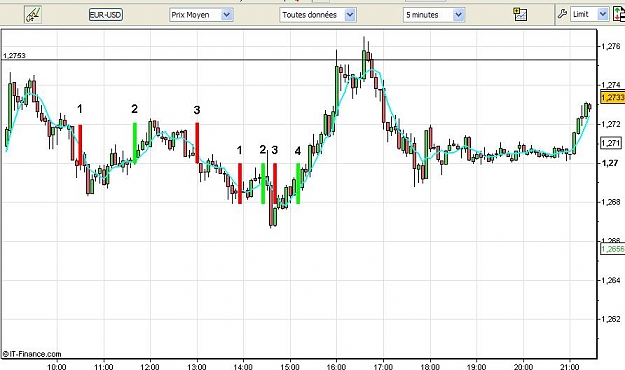
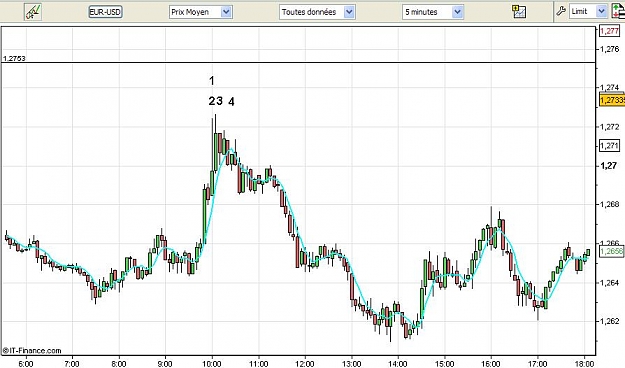
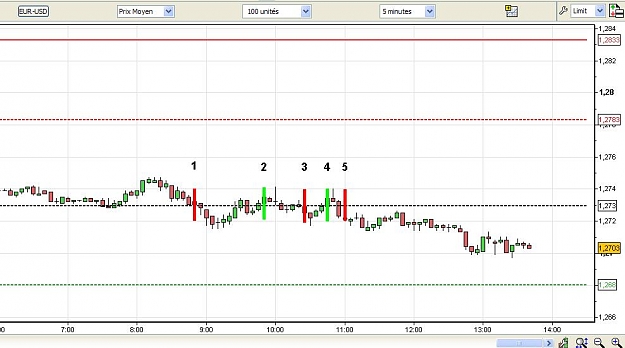
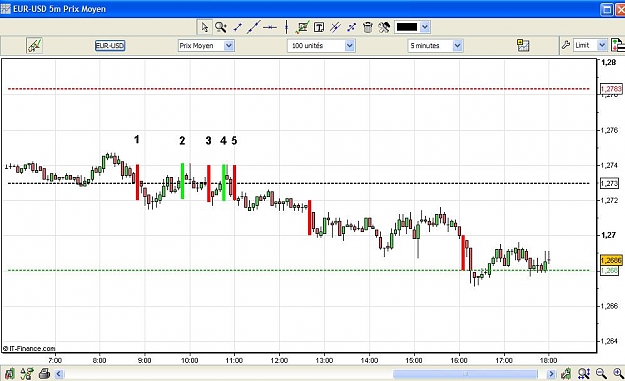
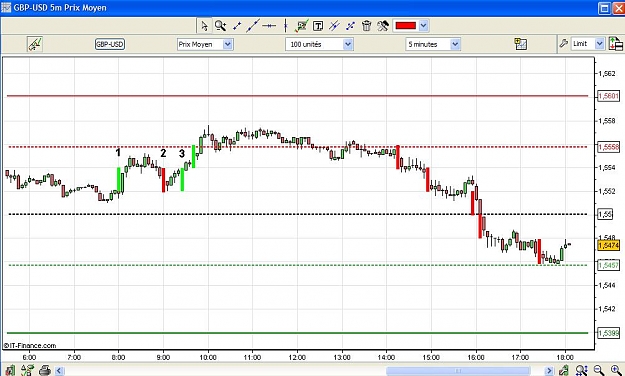
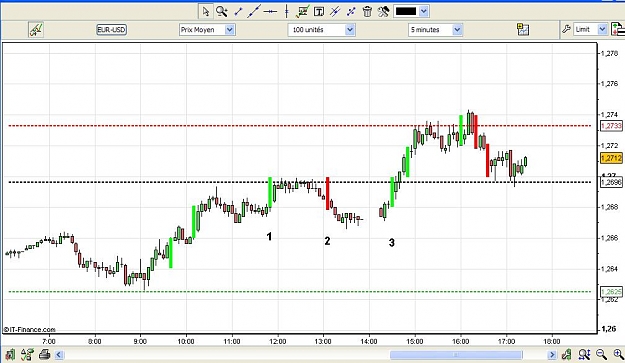
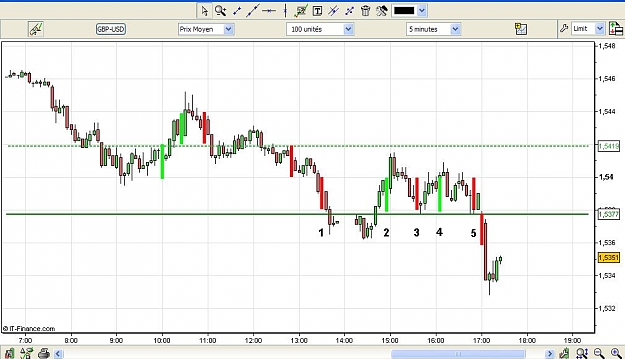
1 When the price forms 4 diferent bars in a row we open a position with the fourh bar. (whatch the pictures below) And if it still makes an opposite bar we double the size until it breaks out of the range or probably ,if you risk to much , blow your account.
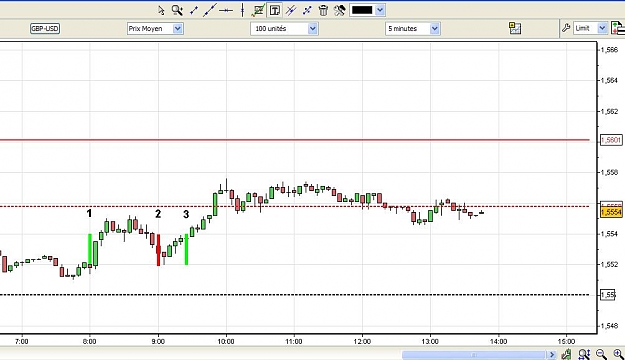
The bar size I use here is 100 pips. Stops and profit size as well. The pair I trade for this is GBP/USD.Someone may want to investigate with other pairs as well.
The later we are in the range the higher probability that it will break out soon with less use of doubling. I would not double more then 4 times.
When you scroll back through the charts you will see how many times the particular pair range and what you can exspect more or less. Some may find need to start trading after only 3 bars but sure this is more risky and I do not recomend that. I do recomend to take responsibility for your own actions and do not blame me if not sucseed.
Take care
S.
The method is very simple and is based on an idea that a range can`t last for ever and it will need to break out at some point with no doubt.
The bars I use here is seen on this thread http://www.forexfactory.com/showthread.php?t=205471which is initiated of Zebulon. I don`t know who has found the idea to drow those bars but I first saw them in this thread and I thank to all participants of it and especially Zebulon.
Lets move on.
We will not need any indicators here and you can just draw those bars manually using rectangles. But there is an indi to do it for you in the second post.Also an indi ploting the horisontal lines on the chart and my template.
Rules
1 When the price forms 4 diferent bars in a row we open a position with the fourh bar. (whatch the pictures below) And if it still makes an opposite bar we double the size until it breaks out of the range or probably ,if you risk to much , blow your account.
The bar size I use here is 100 pips. Stops and profit size as well. The pair I trade for this is GBP/USD.Someone may want to investigate with other pairs as well.
The later we are in the range the higher probability that it will break out soon with less use of doubling. I would not double more then 4 times.
When you scroll back through the charts you will see how many times the particular pair range and what you can exspect more or less. Some may find need to start trading after only 3 bars but sure this is more risky and I do not recomend that. I do recomend to take responsibility for your own actions and do not blame me if not sucseed.
Take care
S.
Attached Image(s) (click to enlarge)